Power bi Dashboard
تفاصيل العمل
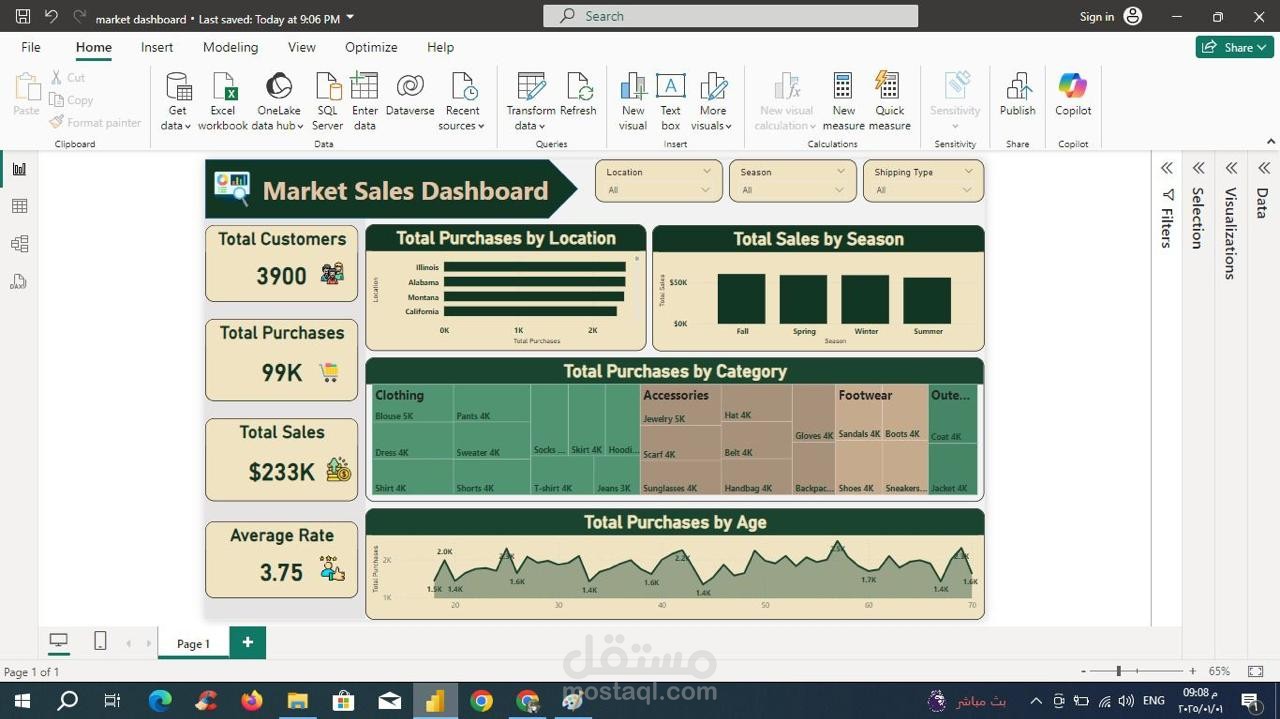
This project focused on helping management monitor and evaluate sales performance across multiple dimensions. Using Power BI, I built a dynamic dashboard that integrates data from different sources, cleans inconsistencies, and provides automated reporting. Key features include:
Revenue tracking by region, product, and sales representative.
Year-over-Year (YoY) and Month-over-Month (MoM) comparisons to detect growth patterns.
Customer segmentation to analyze buying behavior and loyalty.
Profitability insights by product category and discount impact analysis.
The dashboard empowered decision-makers to track KPIs such as total sales, average order value, and sales growth rate in real-time, leading to improved strategies for inventory management, marketing, and sales team performance.
3. Uber Rides Analysis – Tableau