Tableau Dashboard
تفاصيل العمل
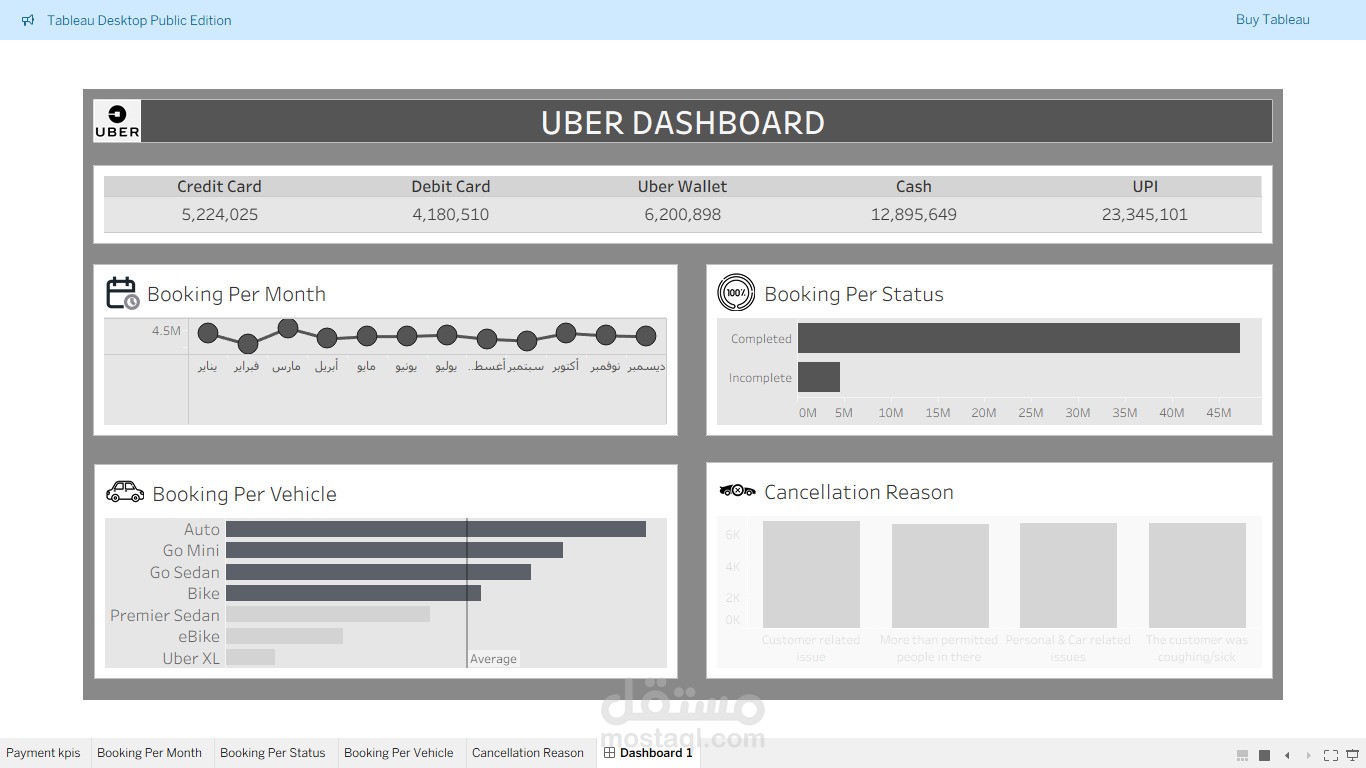
For this project, I created a Tableau dashboard to analyze Uber rides data with the objective of identifying demand trends, geographic patterns, and peak activity times. The dataset was cleaned and structured before building multiple layers of visualization. Key highlights of the dashboard include:
Heatmaps to show ride density across different city locations.
Time-based analysis (hourly, daily, monthly) to detect peak demand periods.
Customer demand forecasting using trends in ride frequency.
Comparisons of ride distribution between weekdays and weekends.
This project showcases how transportation companies can optimize fleet allocation, pricing strategies, and driver distribution by leveraging data visualization for real-time decision-making.
Together, these projects reflect my expertise in data analysis, data modeling, and business intelligence, with proven skills in both Power BI and Tableau to turn raw data into actionable insights and decision-ready dashboards.