Docker-Based Microservices Architecture for Development and Production with Integrated Monitoring
تفاصيل العمل
Docker-Based Microservices Architecture for Development and Production with Integrated Monitoring
Description:
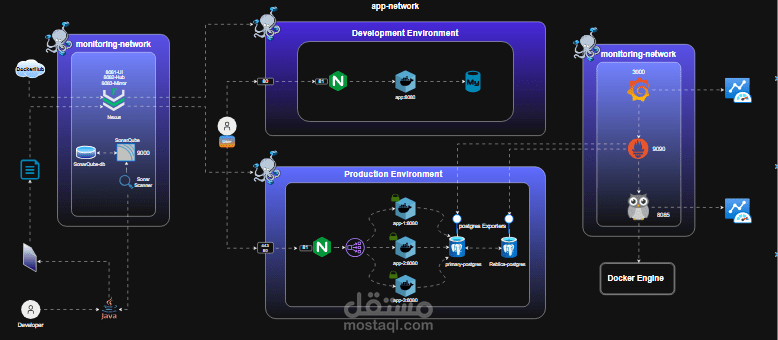
This architectural diagram presents a comprehensive containerized setup using Docker, structured into Development and Production environments, both connected to a shared Monitoring Network.
Development Environment:
Contains app-frontend and app-backend services.
Connected to app-db (database) and app-redis (cache).
Isolated within the app-network, ideal for testing and iteration.
Production Environment:
Features an NGINX load balancer routing traffic to two app-frontend instances.
These frontends communicate with app-backend, which connects to app-db and app-redis.
Also isolated within the app-network, optimized for scalability and performance.
Monitoring Network:
Shared across both environments.
Includes Prometheus (port 9090) for metrics collection and Grafana (port 3000) for visualization.
Prometheus scrapes metrics from application services, enabling real-time observability.
A Java developer and source code repository are shown interacting with the development environment.
Docker Engine underpins the entire setup, orchestrating containers and networks.
This diagram exemplifies best practices in microservices deployment, network isolation, and observability—perfect for showcasing your understanding of scalable, maintainable infrastructure.