Containerized Microservices Architecture with Monitoring Integration
تفاصيل العمل
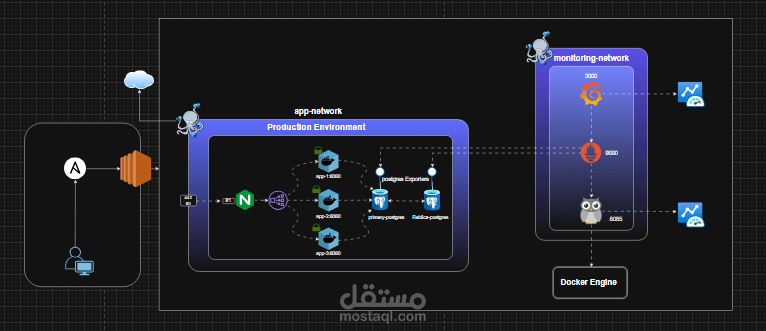
This diagram illustrates a modern containerized application environment using Docker, split into two main networks: the Production Environment (app-network) and the Monitoring Environment (monitoring-network).
Production Environment:
Uses an NGINX reverse proxy to route traffic to three Node.js application containers (app-1, app-2, app-3) running on port 3000.
Includes a PostgreSQL database container with dedicated containers for backups and exports, ensuring data resilience and portability.
Monitoring Environment:
Features Prometheus (port 9090) for metrics collection, Grafana (port 3000) for visualization, and Alertmanager (port 9093) for alerting.
Integrates Node Exporter to gather system-level metrics from the host.
Automation Layer:
Ansible is shown orchestrating deployments and configurations, connected to both the cloud and a user interface.
All components run on Docker Engine, showcasing a scalable and modular microservices setup with robust observability tools.