Mc. Income Statement Analysis Dashboard
تفاصيل العمل
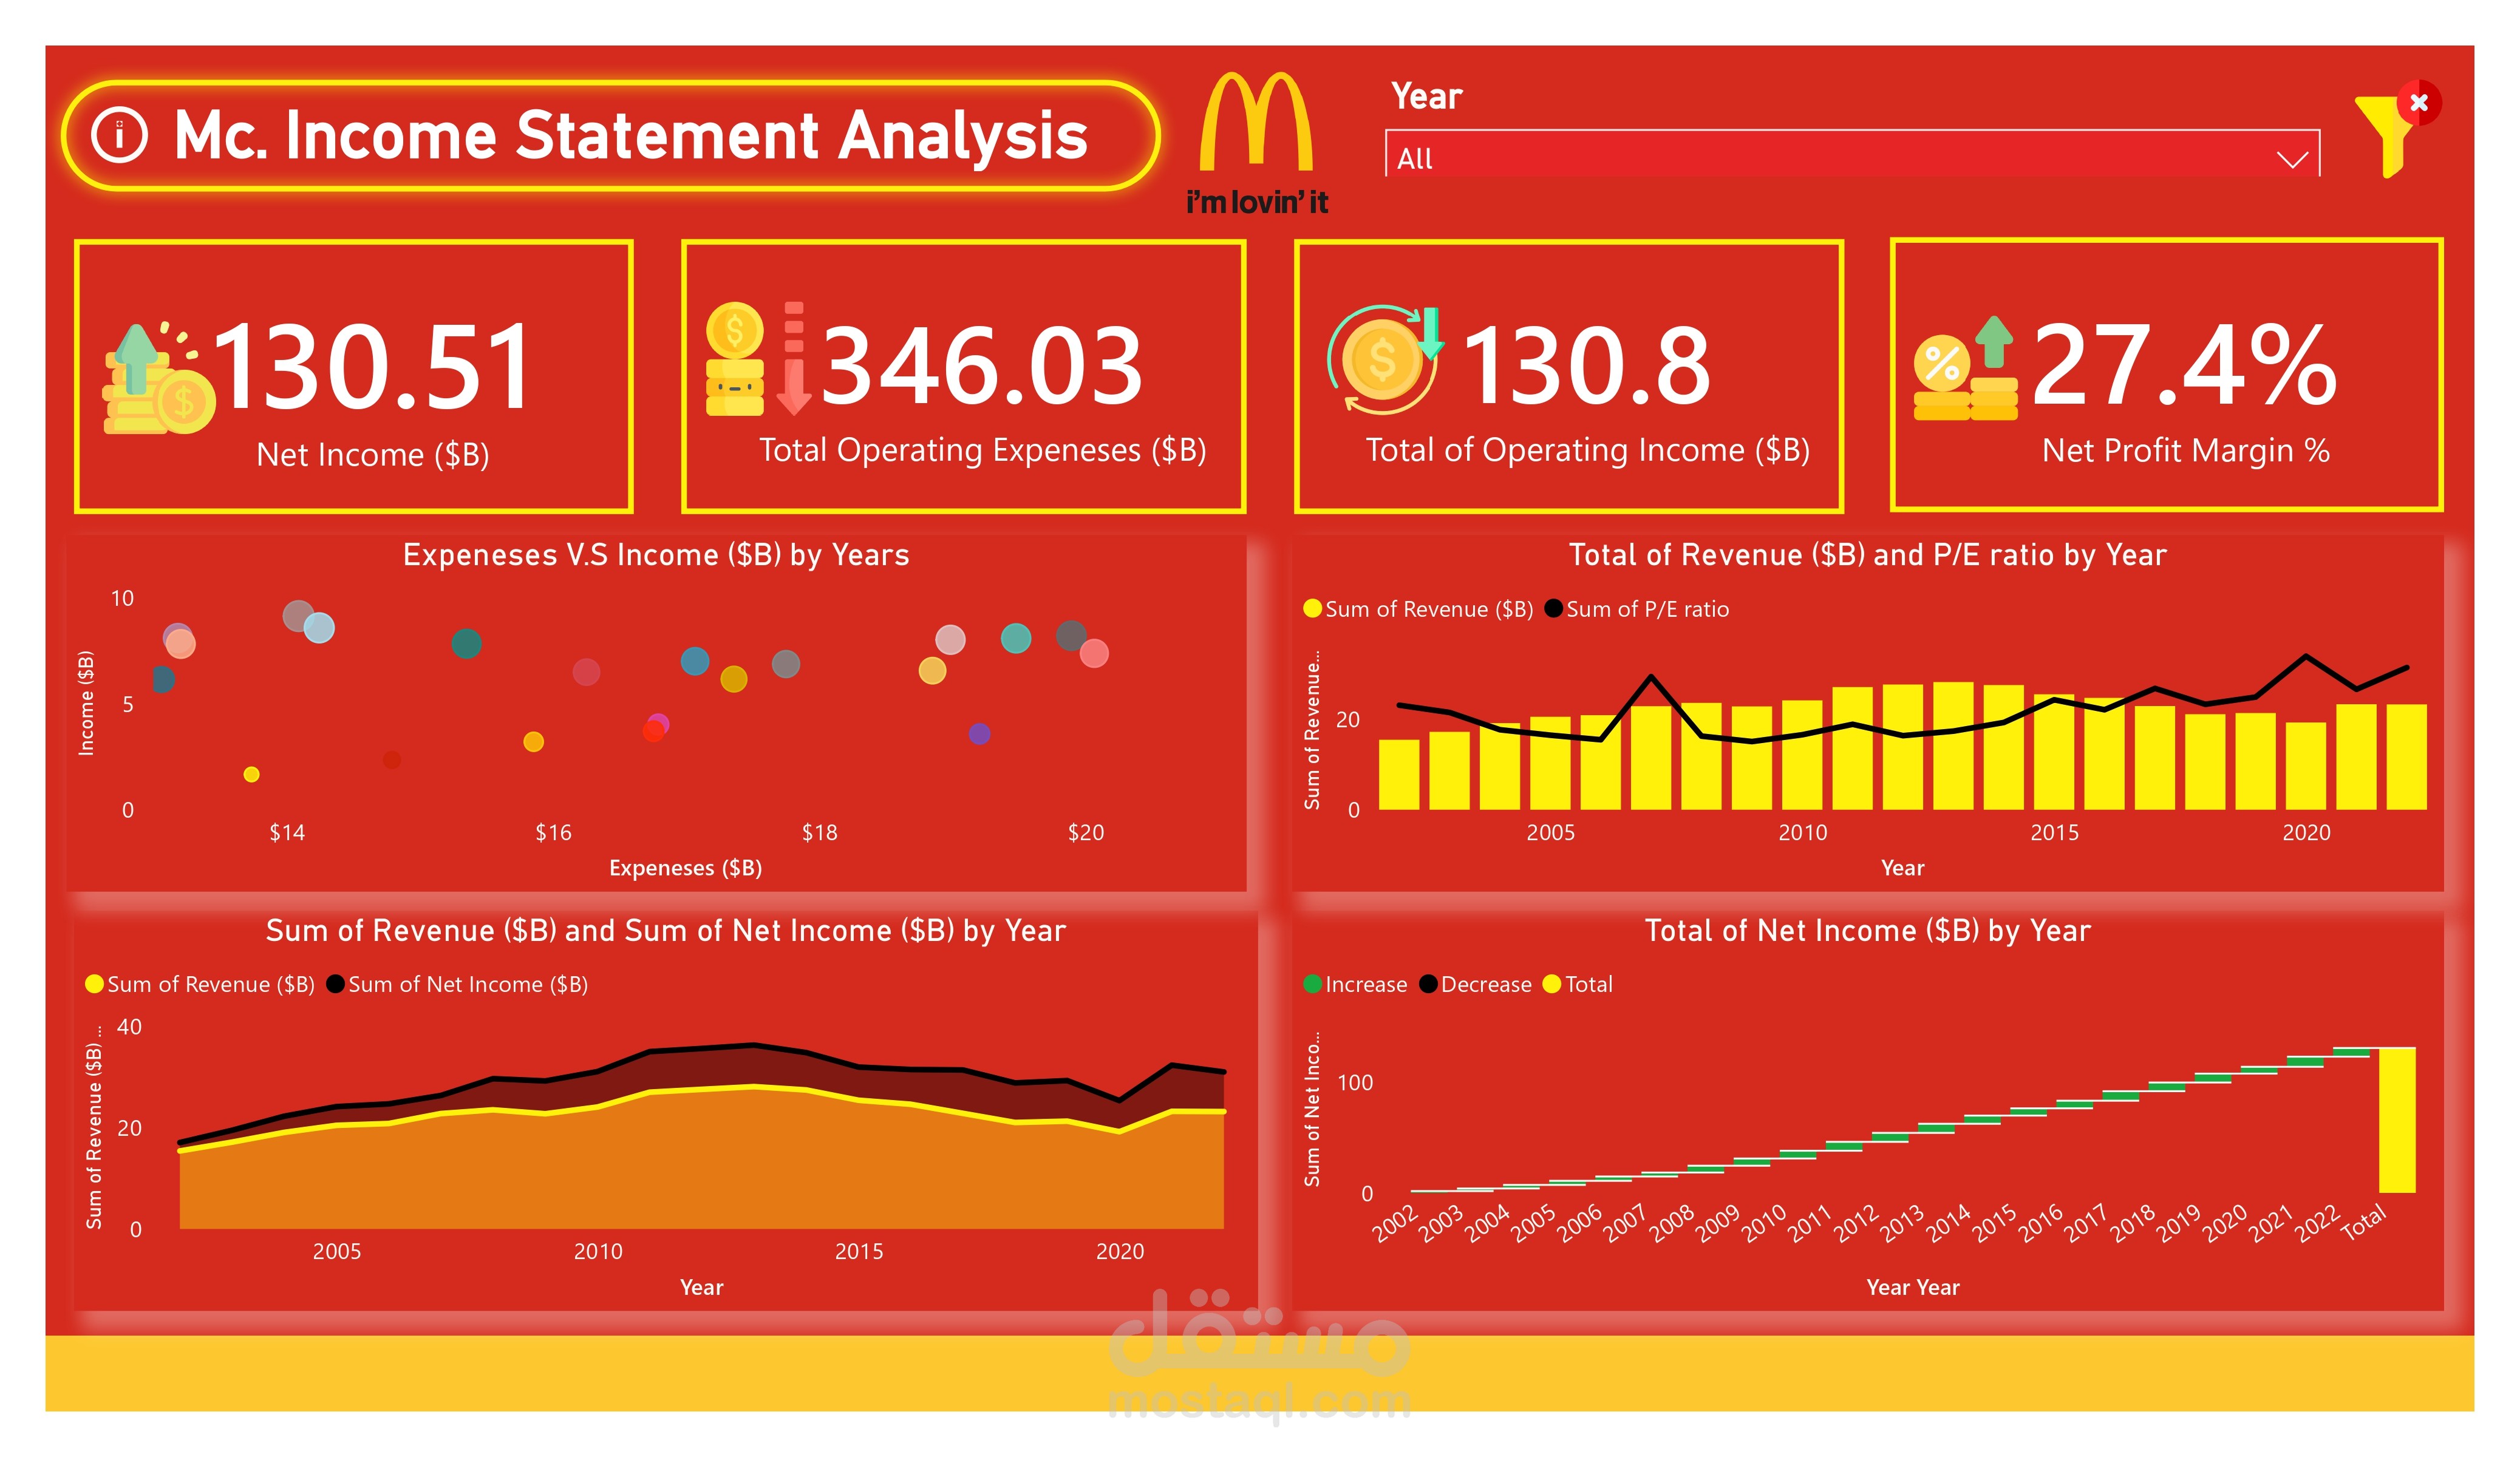
Developed an interactive dashboard using Power BI to analyze the financial performance of Mc. over multiple years. The dashboard includes:
Net Income and Profit Margin analysis.
Revenue vs. Operating Expenses comparison.
Price-to-Earnings (P/E) ratio trends.
Year-over-year Revenue and Net Income growth.
This project demonstrates the ability to transform complex financial data into clear, actionable insights that support strategic decision-making.