Vehicle-Sales-Analysis
تفاصيل العمل
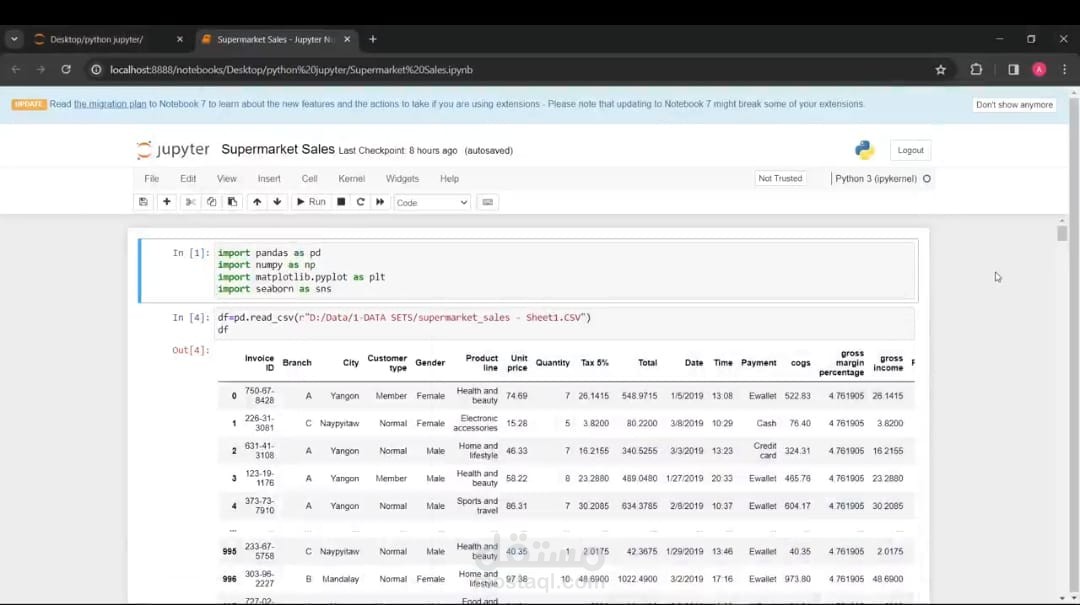
Welcome to my Vehicle Sales Analysis Portfolio Project! In this project, I leverage Python and its powerful libraries—Pandas and NumPy for data cleaning, and Matplotlib and Seaborn for visualization—to conduct comprehensive analysis of vehicle sales data. My primary objective is to ensure data integrity and accuracy, enabling insightful analysis and visualization of trends within the automotive industry.
Data Cleaning
With a meticulous approach, I utilize Pandas for data manipulation and NumPy for numerical operations to perform thorough data cleaning on the vehicle sales dataset. This involves removing unnecessary columns, handling missing values, and resolving any anomalies to maintain the integrity of the dataset. Additionally, I implement advanced techniques to address duplicates and ensure the dataset's reliability.
Visualization
Once the data is cleaned and preprocessed, I harness the visualization capabilities of Matplotlib and Seaborn to create visually appealing representations. Matplotlib is used for creating static, interactive, and animated visualizations, while Seaborn provides a high-level interface for drawing attractive and informative statistical graphics. My visualizations offer a comprehensive exploration of various aspects of vehicle sales, including sales volumes, market segmentation, pricing dynamics, and geographical distribution. Through intuitive visualizations, I aim to present insights and trends that empower stakeholders to make informed decisions within the automotive industry.
Thank you for exploring my Vehicle Sales Analysis Portfolio Project. Together, let's unlock the potential of data analysis and visualization to drive meaningful insights in the automotive industry.