Google-Capstone-Project
تفاصيل العمل
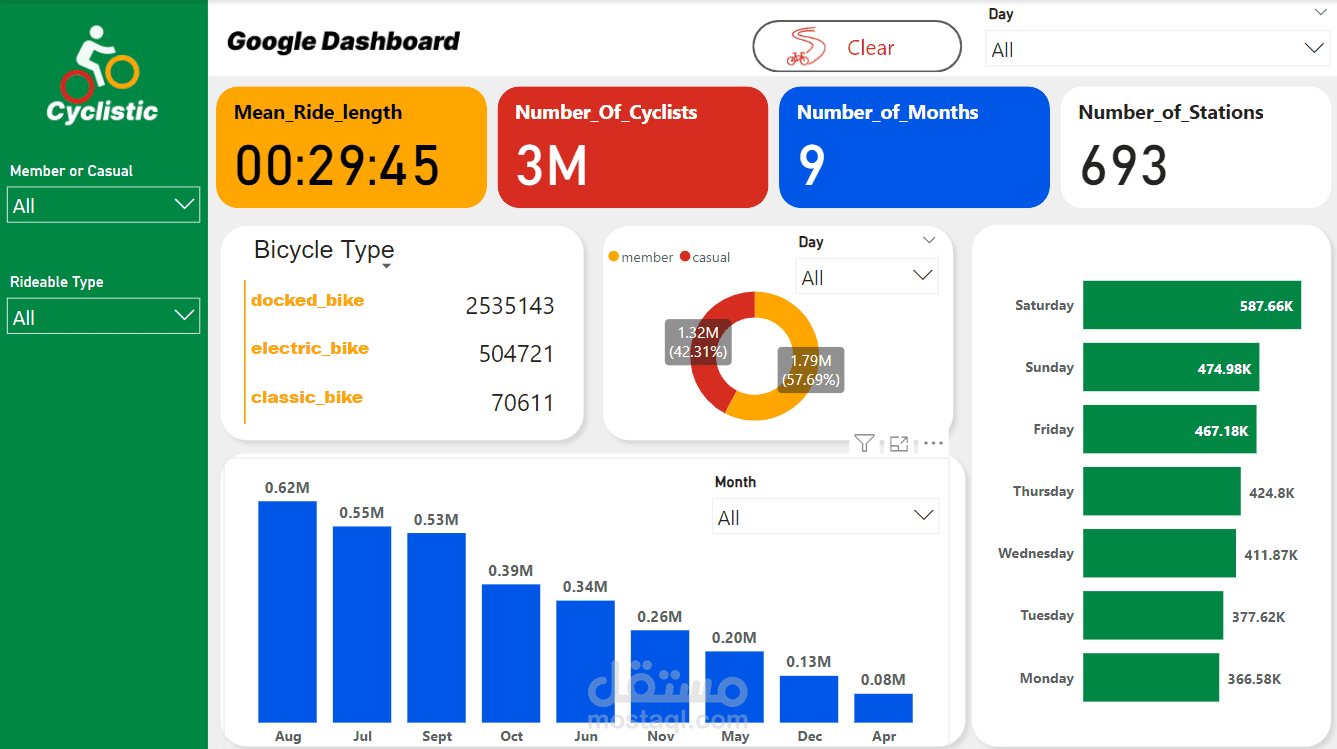
Google Capstone Project: Bike Data Analysis
Overview
This repository contains the code and documentation for my completion of the Google Capstone project focusing on bike data analysis. The project involved utilizing SQL for data manipulation and analysis, as well as Power BI for creating interactive dashboards to visualize insights.
Project Objectives
Analyze a large dataset containing bike usage data.
Extract insights and trends surrounding bike usage patterns.
Utilize SQL for efficient data querying and manipulation.
Create visually compelling dashboards using Power BI to communicate findings effectively.
Technologies Used
SQL: Used for data manipulation, querying, and analysis.
Power BI: Utilized to create interactive dashboards for visualizing insights.
GitHub: Repository hosting and version control.
Project Structure
data: Contains the dataset used for analysis.
sql_queries: SQL queries used for data manipulation and analysis.
power_bi: Power BI files for creating visual dashboards.
README.md: This file providing an overview of the project.
Getting Started
To replicate or explore the analysis:
Clone this repository to your local machine.
Navigate to the sql_queries directory to access the SQL scripts.
Use your preferred SQL client to run the queries on the provided dataset.
Navigate to the power_bi directory to access the Power BI files.
Open the Power BI files to explore the visual dashboards.
Acknowledgments
Google: For providing the opportunity to work on this Capstone project and enhance my skills in data analysis.
Instructors and peers: For their guidance, support, and collaboration throughout the project.