MISUO_Datat_set
تفاصيل العمل
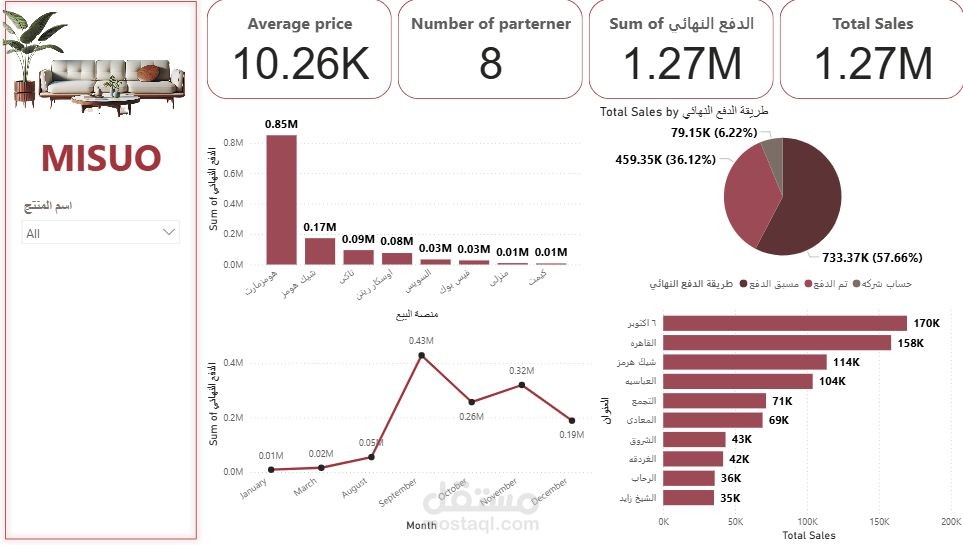
MISUO Furniture Business - Data Analysis Project
Project Overview
This project focuses on performing Exploratory Data Analysis (EDA) for the MISUO furniture business.
The workflow starts with Excel for initial data understanding and cleaning, then moves to Power Query for advanced data preparation, followed by Power Pivot (DAX) for calculations, and finally Power BI for interactive visualization and business insights.
Steps
1. Exploratory Data Analysis (EDA) in Excel
Explored the dataset to understand each column and its meaning.
Identified missing values, duplicates, and inconsistencies.
Added new calculated columns to support deeper analysis.
2. Data Cleaning with Power Query
Removed null values.
Eliminated duplicate records.
Fixed inconsistent data entries.
Built a cleaned and structured dataset ready for analysis.
3. Data Modeling with Power Pivot
Added measures and DAX calculations such as:
Total Sales
Average Price
Number of Partners
Total Orders
4. Business Insights with Pivot Tables
Analyzed key business questions, including:
Who are the top customers?
Which location generates the most sales?
Who are the top-performing partners?
What factors affect delivery time?
5. Visualization with Power BI
Imported the cleaned Excel dataset into Power BI.
Designed interactive dashboards with suitable charts.
Applied a consistent color theme to enhance readability and aesthetics.
Key Insights
Identified the most valuable customers and locations with highest sales.
Highlighted partner performance and business growth opportunities.
Discovered patterns in delivery times and areas for process improvement.
️ Tools Used
Excel – Data exploration and preparation.
Power Query – Data cleaning and transformation.
Power Pivot (DAX) – Measures and calculations.
Power BI – Visualization and reporting.
Outcome
This project provides MISUO with a data-driven decision-making tool, enabling better understanding of sales performance, customer behavior, and business opportunities through clear and interactive dashboards.