Sales Performance Dashboard
تفاصيل العمل
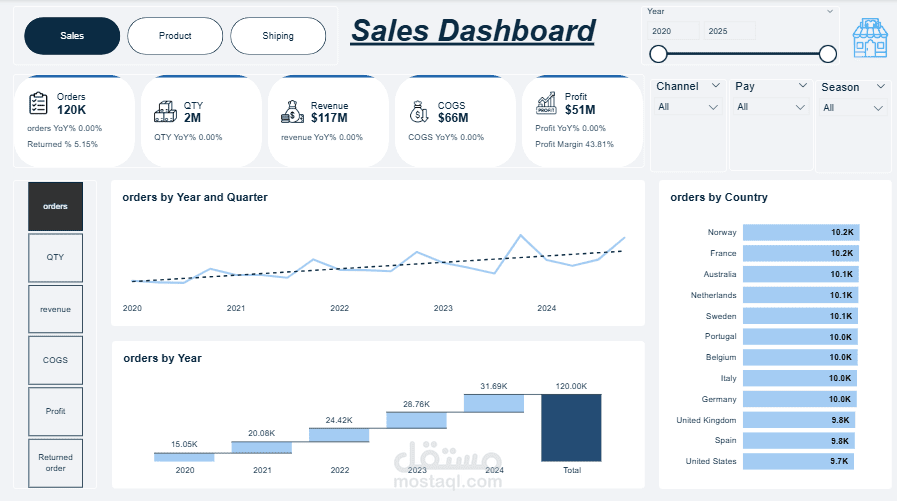

I created an interactive Sales Dashboard for SmartMart to analyze and visualize key business metrics across sales, revenue, profit, and customer distribution. The purpose was to deliver a complete view of sales performance and support managers in making data-driven decisions.
Key Features & Components
KPI Cards:
Orders: 120K
Quantity: 2M units
Revenue: $117M
COGS: $66M
Profit: $51M (Profit Margin 43.81%)
Trend Analysis: Orders tracked by year and quarter, highlighting growth patterns from 2020 to 2025.
Orders by Year: Waterfall chart displaying incremental yearly sales to monitor overall growth.
Orders by Country: Comparative analysis of top-performing markets such as Norway, France, Australia, Netherlands, and the United States.
Filters & Slicers: Interactive filtering by year, channel, payment method, and season for deeper insights.
Tools & Technologies
Power BI for building dynamic dashboards.
Power Query for cleaning and shaping raw sales data.
DAX measures for calculating KPIs and profit margins.
Outcome & Impact
The dashboard allowed SmartMart’s management to:
Monitor sales performance across different years and regions.
Identify the most profitable countries and sales channels.
Track profitability while keeping an eye on costs and returns.
Gain flexibility through filters to explore data at multiple levels (global → regional → yearly).
This project highlights my ability to turn raw business data into clear, visual, and actionable insights that support strategic growth and operational efficiency.