FitBit Health Analytics Dashboard
تفاصيل العمل
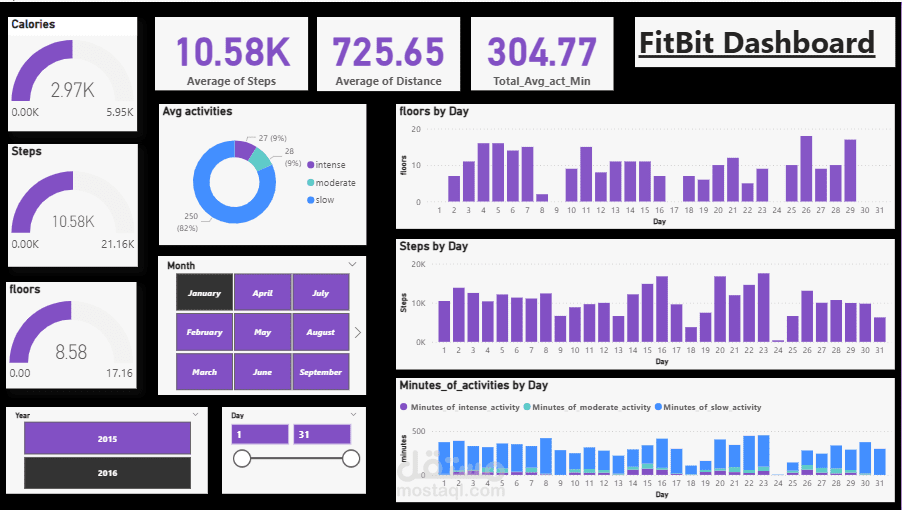

I developed an interactive health analytics dashboard using FitBit data to provide deep insights into daily activity, fitness levels, and lifestyle patterns. The goal of the project was to help users better understand their health metrics and track their progress over time in a clear and engaging way.
Key Features & Components
Calories Tracking: Visualized daily calories burned, with progress indicators toward activity targets.
Steps Analysis: Displayed total steps per day, average steps per month, and comparison against set goals.
Floors Climbed: Monitored floors by day, giving users insight into their physical activity intensity.
Distance & Activity Minutes: Showed averages of distance covered and total minutes of activity across different intensity levels (intense, moderate, and slow).
Activity Breakdown: Pie chart representation to quickly show proportions of different activity intensities.
Trend Analysis: Line and bar charts tracking daily performance, highlighting trends, peaks, and drops.
Interactive Filters: Users can filter by year, month, and day to drill down into specific time periods and view targeted insights.
Tools & Technologies
Power BI for dashboard design, interactivity, and visualization.
Power Query for data cleaning and transformation.
DAX measures for calculating averages, totals, and KPIs.
Outcome & Impact
The dashboard enabled users to:
Monitor real-time progress toward health goals.
Identify lifestyle patterns that influence fitness and wellness.
Compare performance across different periods (daily, monthly, yearly).
Take data-driven decisions to improve activity levels, sleep patterns, and overall health.
This project demonstrates the ability to transform raw wearable device data into a professional, easy-to-use tool that adds real value for individuals and organizations interested in health analytics.