Stock Market Analysis (2020-2024)
تفاصيل العمل

Overview
The purpose of this project is to evaluate and compare the financial performance of a diverse set of assets—ranging from a commodity (Gold Futures) to major tech stocks (Apple, Microsoft, Tesla) and a broad market index (S&P 500 ETF). By examining historical price data, daily returns, and cumulative returns, this analysis aims to identify trends, volatility, and profitability over the specified period. This project serves as a practical demonstration of financial data analysis using Python and can be useful for investors, data enthusiasts, or anyone interested in stock market trends.
Approach
The analysis follows these steps:
Data Collection: Historical price data is fetched from Yahoo Finance using the yfinance library for the symbols GC=F, AAPL, MSFT, SPY, and TSLA, spanning from January 1, 2020, to the present (dynamically set to the current date).
Data Processing: Adjusted closing prices are extracted, combined into a single DataFrame, and cleaned to remove missing values.
Analysis:
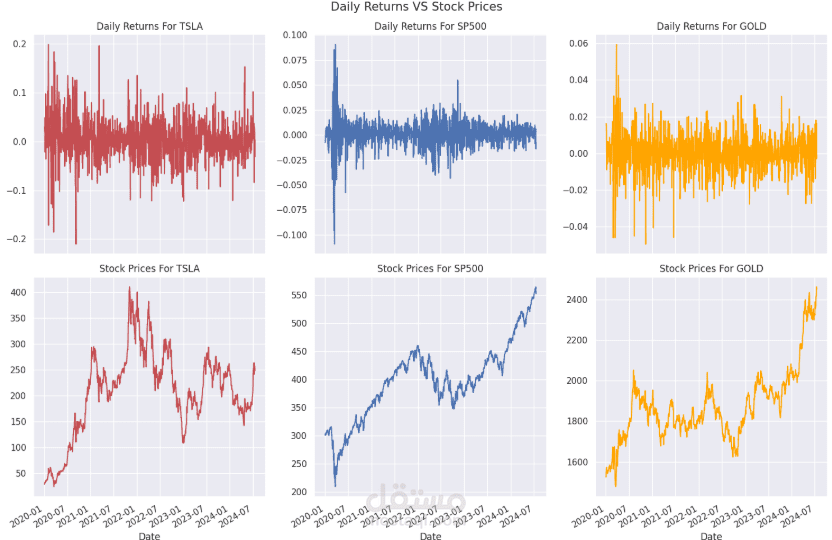
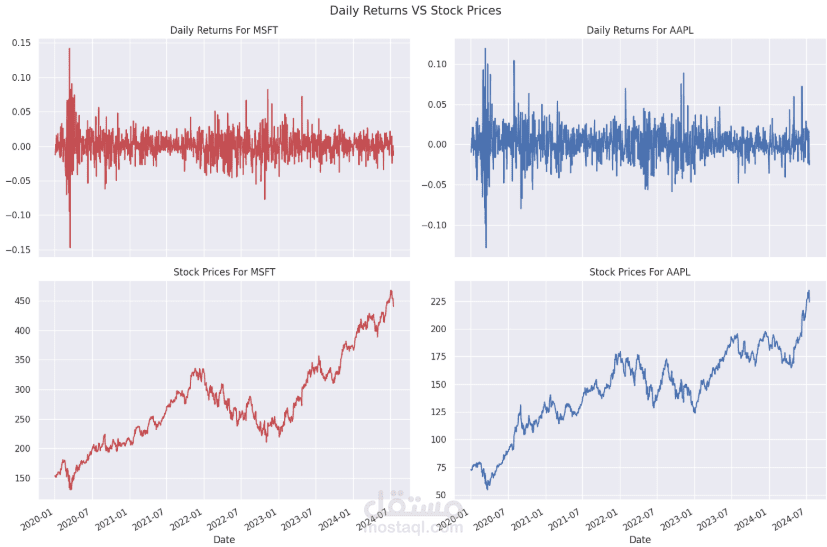
Daily Returns: Calculated as the percentage change in adjusted closing prices to assess day-to-day volatility.
Cumulative Returns: Computed to measure total growth over the period, expressed as a percentage relative to the starting price.
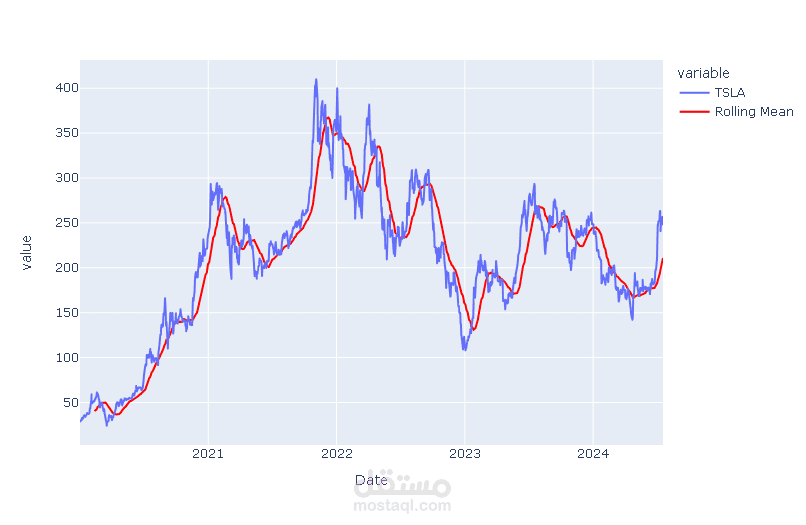
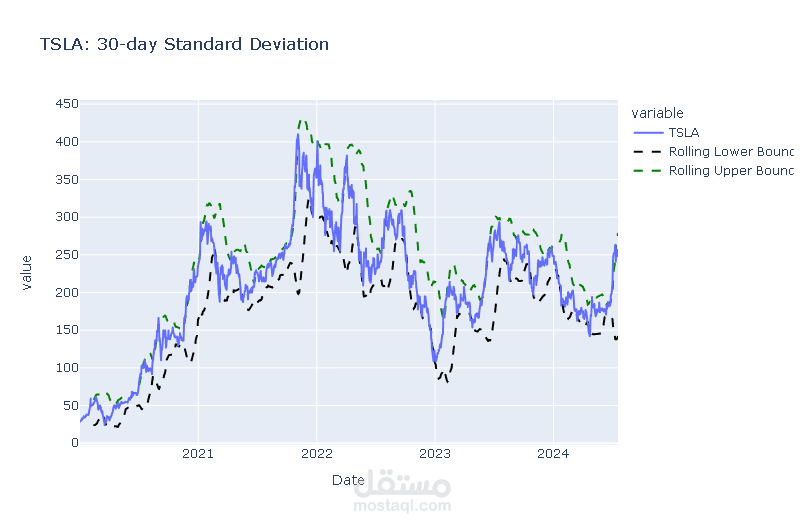
Visualization: Histograms for daily return distributions (e.g., Tesla) and line plots for cumulative returns are generated using seaborn and matplotlib.
Tools: The project leverages Python libraries such as pandas for data manipulation, numpy for numerical operations, and seaborn/matplotlib for plotting.
Conclusion
The analysis reveals distinct performance profiles for each asset:
Tesla (TSLA): Achieved the highest cumulative return (~740%), but with significant volatility (daily returns ranging from -20% to +20%).
S&P 500 (SPY): Most stable option with a cumulative return of ~84% and daily returns typically between -5% and +5%.
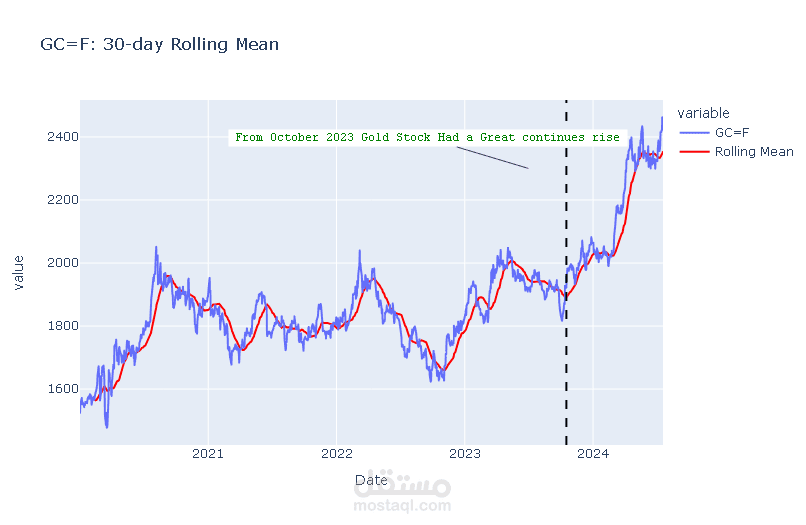
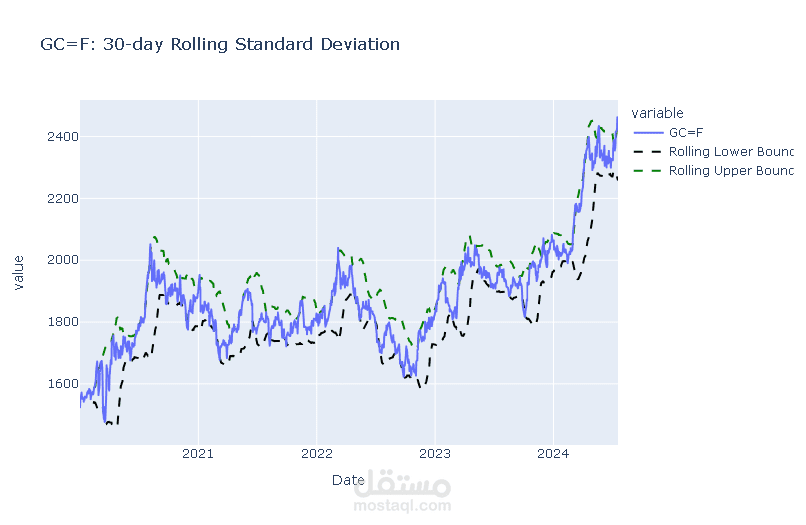
Gold Futures (GC=F): Delivered a modest cumulative return of ~58%, acting as a less volatile hedge.
Apple (AAPL) and Microsoft (MSFT): Showed strong growth with cumulative returns of ~212% and ~195%, respectively, balancing profitability and stability.
These findings highlight Tesla’s high-risk, high-reward nature, the S&P 500’s reliability, and the tech giants’ consistent performance, providing insights into asset selection based on risk tolerance and investment goals.