E-Commerce Data Analysis & Customer Segmentation Project
تفاصيل العمل
This project conducts a deep-dive analysis of a transnational e-commerce dataset to uncover actionable business insights. The goal was to move beyond simple reporting and build a data-driven framework for understanding customer behavior, optimizing marketing strategies, and driving revenue growth. The final deliverable is an interactive Power BI
dashboard and a strategic executive summary.
◘ Key Questions Answered
•Who are our most valuable customers and how do we retain them?
•What are the sales trends and how can we optimize operations?
•Which products and regions present the biggest opportunities?
•Why do customers churn and how can we win them back?
◘ Tools & Technologies
•Programming Language: Python (Pandas, NumPy, Matplotlib, Seaborn)
•Data Visualization: Power BI, Tableau
•Database: SQL (for data wrangling)
•Version Control: Git, GitHub
•Methodologies: RFM Analysis, Cohort Analysis, Time Series Analysis, Data Cleaning & Wrangling
◘ Data Cleaning & Preprocessing
The raw data required extensive cleaning to ensure analytical integrity. A nuanced, two-tiered approach was used to handle different business contexts.
1. Data Type Conversion
•Converted InvoiceDate to a datetime object for time-series analysis.
•Converted CustomerID to a string (object) type to represent it as a unique identifier.
2. Handling Duplicate Records
•Issue: 5,268 records were exact duplicates across all columns.
•Root Cause: Determined to be system errors in data logging.
•Action: Removed all duplicate rows, keeping only the first occurrence.
•Impact: Prevented artificial inflation of sales metrics.
3. Handling Missing Values
•Issue: 25% of CustomerID values were missing.
•Investigation: These records were primarily for operational items (e.g., 'DOTCOM POSTAGE', 'JUMBO BAG') and system adjustments, not representative of customer purchases.
•Action: Implemented a segmented approach:
obusiness_df: Kept all records for accurate financial reporting.
oanalysis_df: Removed records with null CustomerID for clean customer behavior analysis.
4. Handling Invalid and Extreme Values
•Investigation: Negative values in Quantity and UnitPrice represented valid business actions like returns and accounting adjustments. Extremely high quantities indicated wholesale orders, and high prices were operational fees.
•Action: Created a refined analysis_df for customer behavior by applying filters:
oQuantity > 0 and UnitPrice > 0
oCapped quantities and prices at reasonable thresholds for retail.
oFiltered out transactions with non-product descriptions (e.g., 'POSTAGE', 'FEE').
◘ Analysis & Methodology
1. Exploratory Data Analysis (EDA)
Conducted a thorough univariate and multivariate analysis to understand distributions, correlations, and patterns.
•Temporal Analysis: Sales trends over time, daily/weekly/hourly patterns.
•Geographic Analysis: Revenue and order distribution by country.
•Product Analysis: Identification of best/worst-selling products and categories.
2. RFM Analysis (Recency, Frequency, Monetary)
Segmented the customer base into distinct groups for targeted marketing.
•Recency (R): Days since last purchase.
•Frequency (F): Number of transactions.
•Monetary (M): Total revenue from the customer.
•Segments Identified:
oChampions: Best customers, drive the majority of revenue.
oLoyal Customers: Reliable, consistent purchasers.
oPotential Loyalists: Recent customers with high potential.
oAt-Risk Customers: High-value customers who are churning.
oNeeds Attention: Dormant, low-engagement customers.
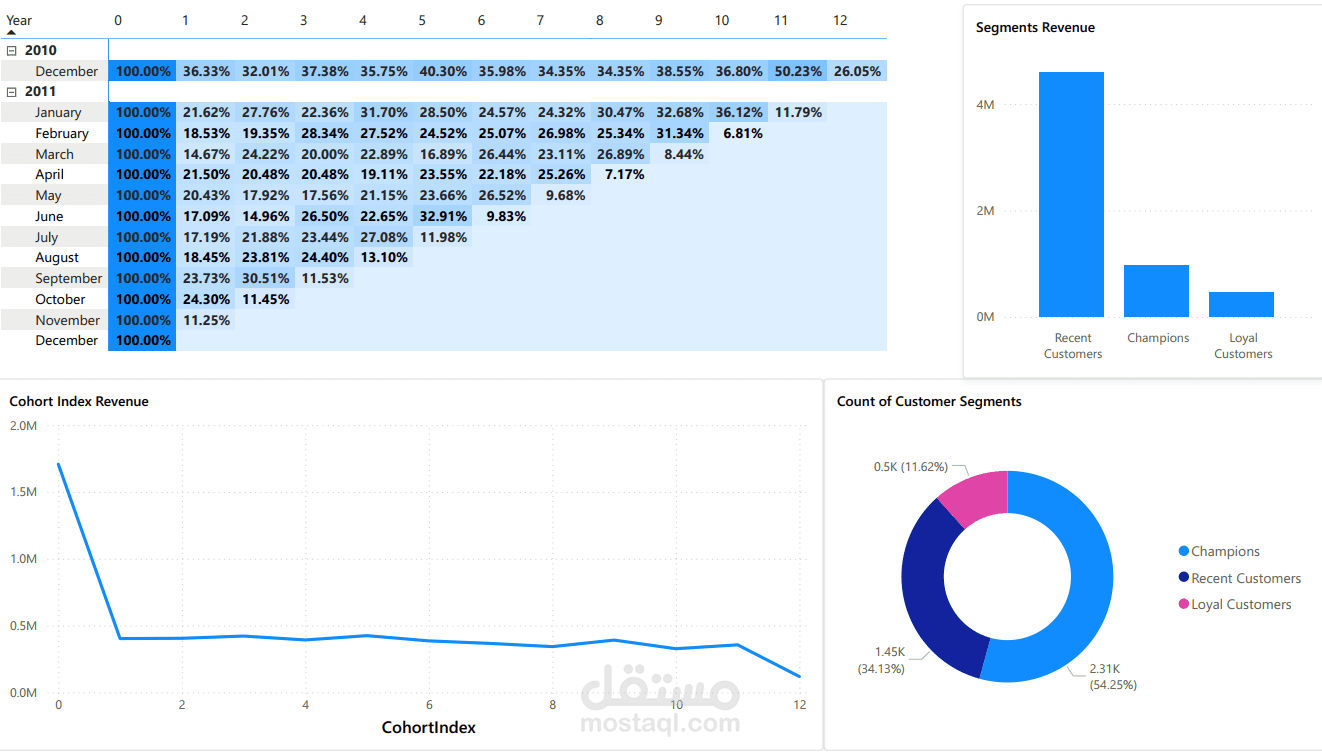
3. Cohort Analysis
Analyzed customer retention rates over time.
•Method: Grouped customers by their acquisition month and tracked the percentage who made purchases in subsequent months.
•Key Insight: Identified a concerning trend of declining retention rates throughout 2011, highlighting a need for improved customer onboarding and engagement.
◘ Key Insights & Findings
Customer Behavior
•The 80/20 Rule is Evident: The top segment ("Champions"), comprising only 643 customers, generates a massively disproportionate amount of revenue.
•Retention is a Key Opportunity: Cohort analysis reveals a significant drop-off in customers after 3 months.
•Clear Shopping Patterns: Sales peak on Thursdays and during mid-day hours (10 AM - 3 PM), which generates nearly 80% of daily revenue.
Product & Sales Analysis
•Top Product: "REGENCY CAKESTAND 3 TIER" is the top revenue-generating product ($142K).
•Market Concentration: The UK drives over 80% of all revenue. The Netherlands shows a higher value per order than Germany, suggesting an untapped opportunity.