Dashborad
تفاصيل العمل
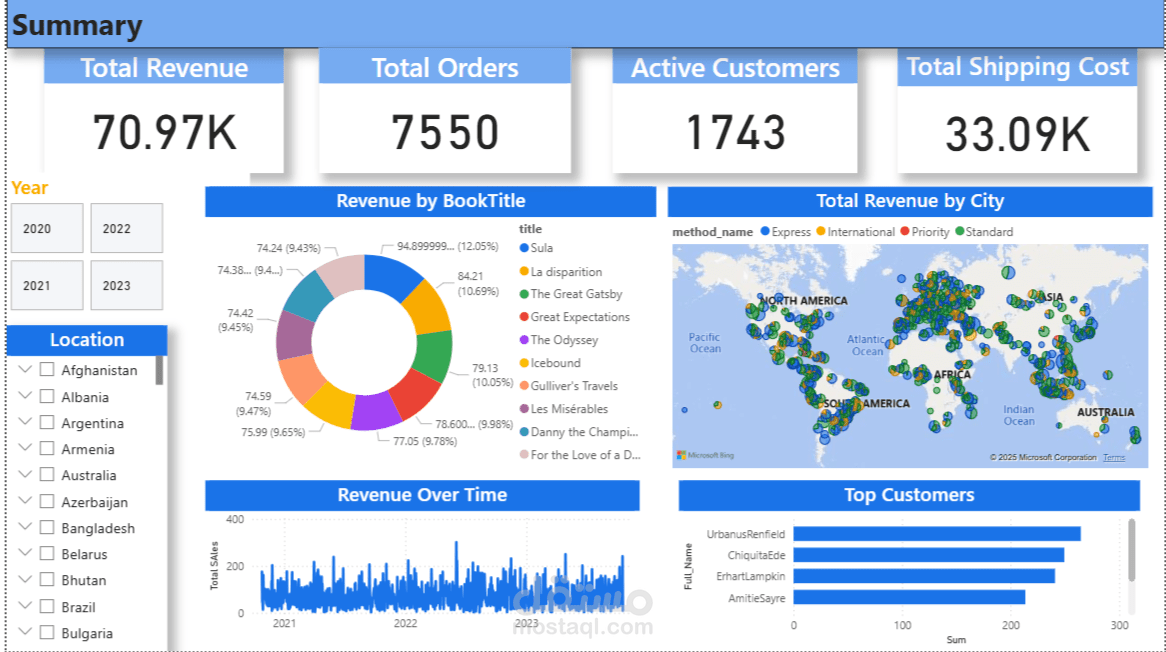
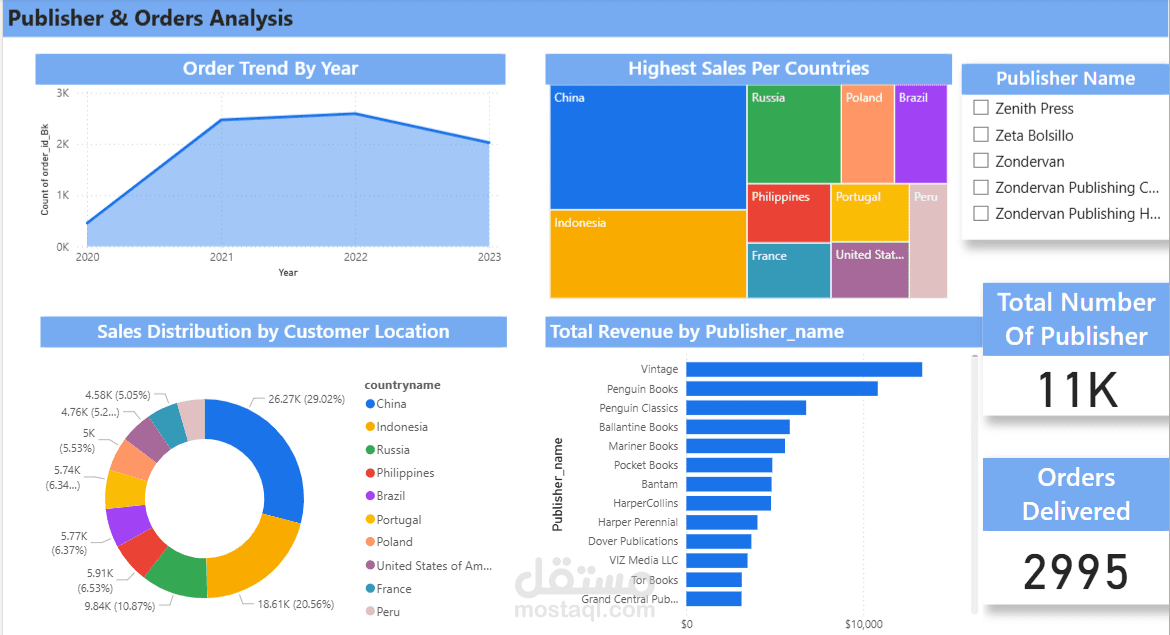
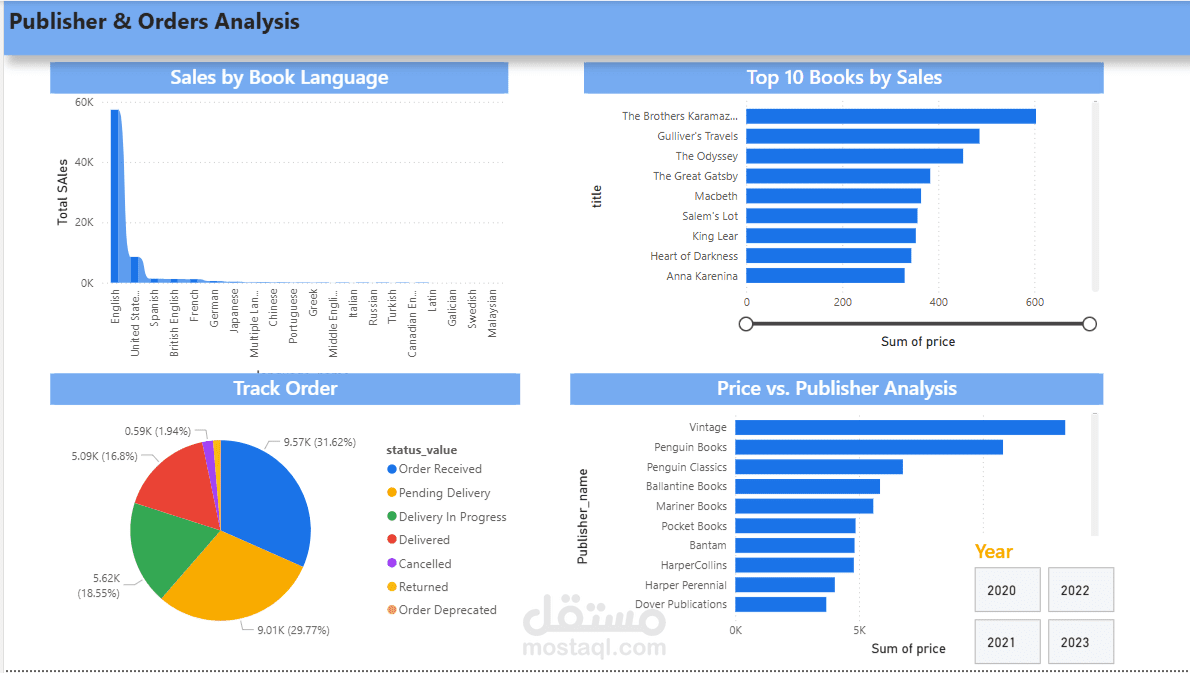
Dashboard by power bi
Data pipeline: Source data came from an OLTP schema of Books, Authors, Orders, and Publishers, loaded via an SSIS package (with the Author dimension modeled as a Slowly Changing Dimension Type 2 to keep historical changes).
Visuals & KPIs:
Total Sales & Profit cards
Cost vs. Price analysis (clustered bar charts)
Top-selling authors and publishers
Slicers for Book Title, Shipping Method, and Order Status
Business impact: Helped stakeholders spot high-cost/low-revenue publishers, track sales trends over time, and evaluate author performance even when their details changed historically.
This project provided management with a single, interactive source of truth for sales performance and profitability, enabling data-driven decisions.