retail product performance
تفاصيل العمل

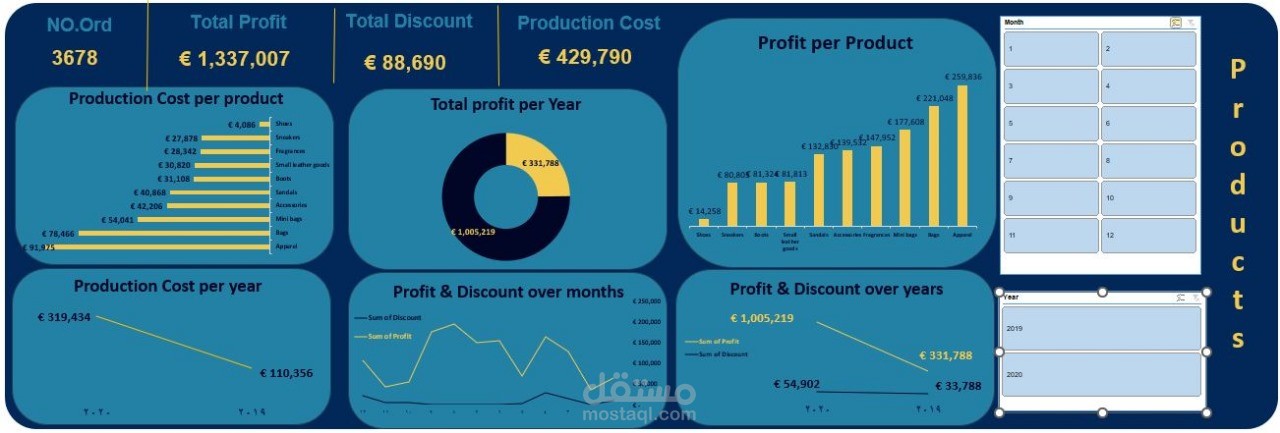
Using Excel and Power Query, I analyzed retail product performance to answer key business questions, including total profit, production cost, and performance by product, year, and month.
This dashboard highlights:
* Profit and production cost per product
* Trends across months and years
* KPIs like total orders, profit, and discount