Financial Analysis
تفاصيل العمل
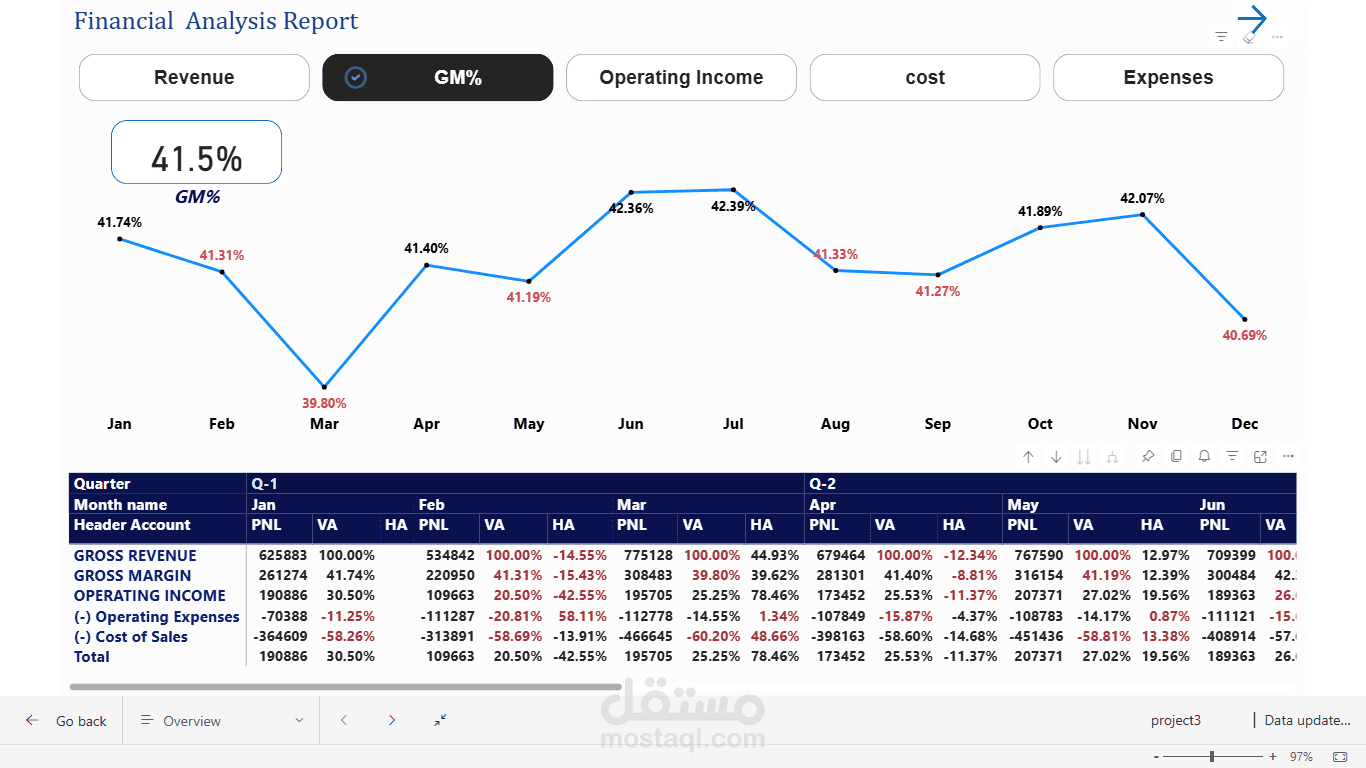
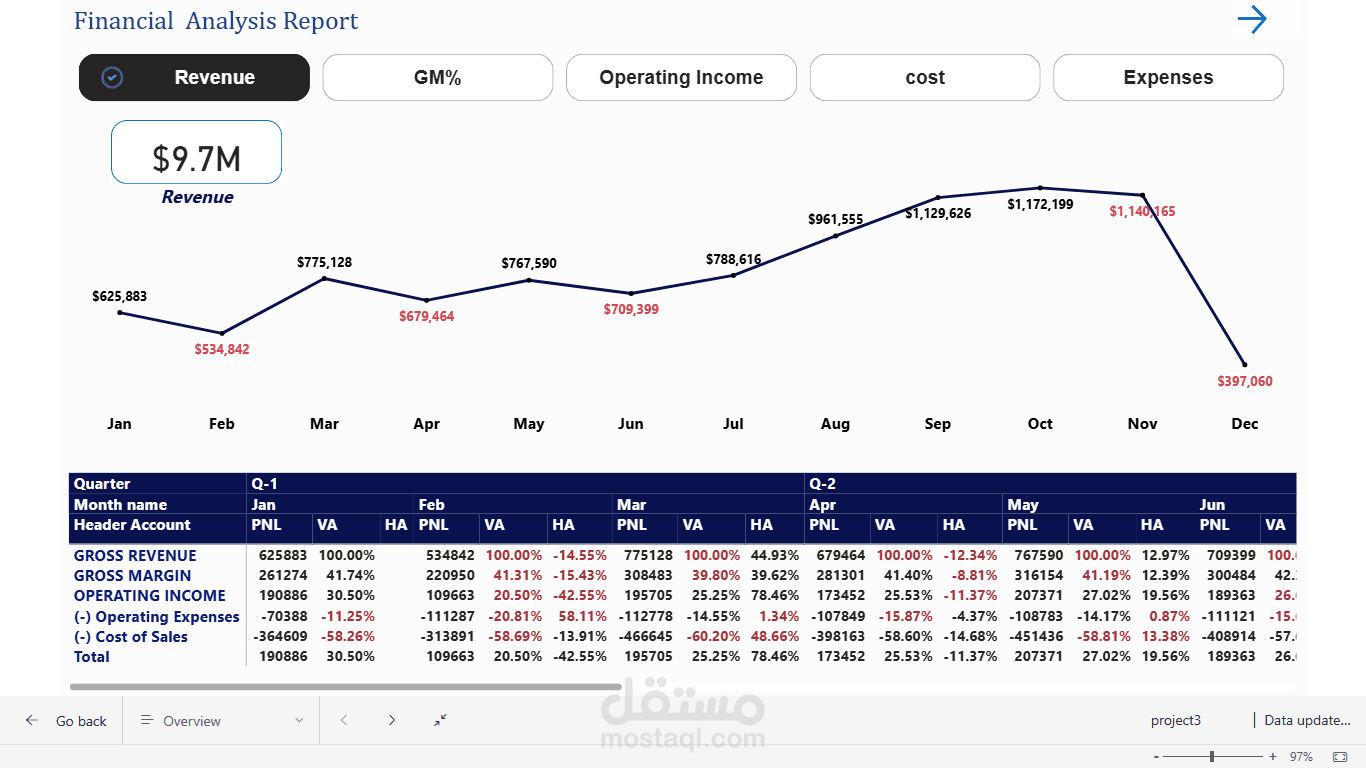
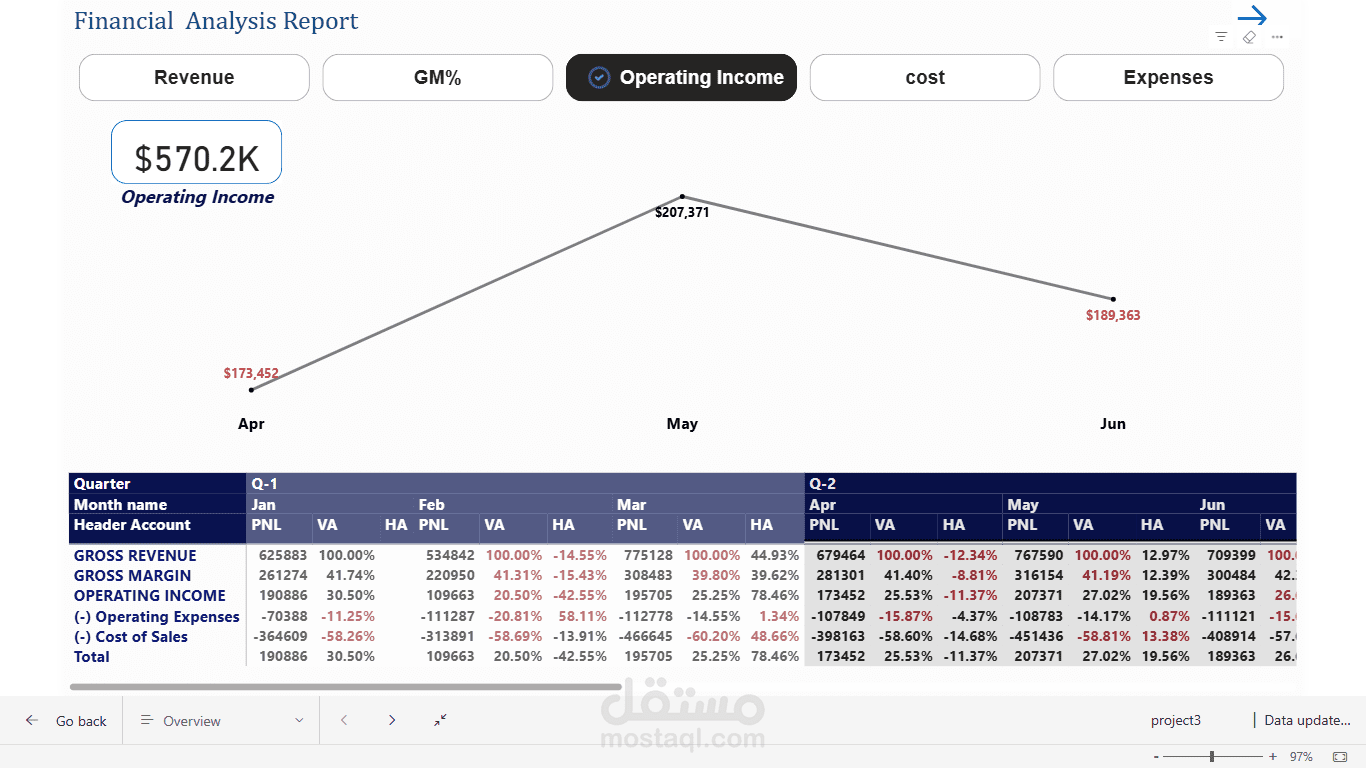
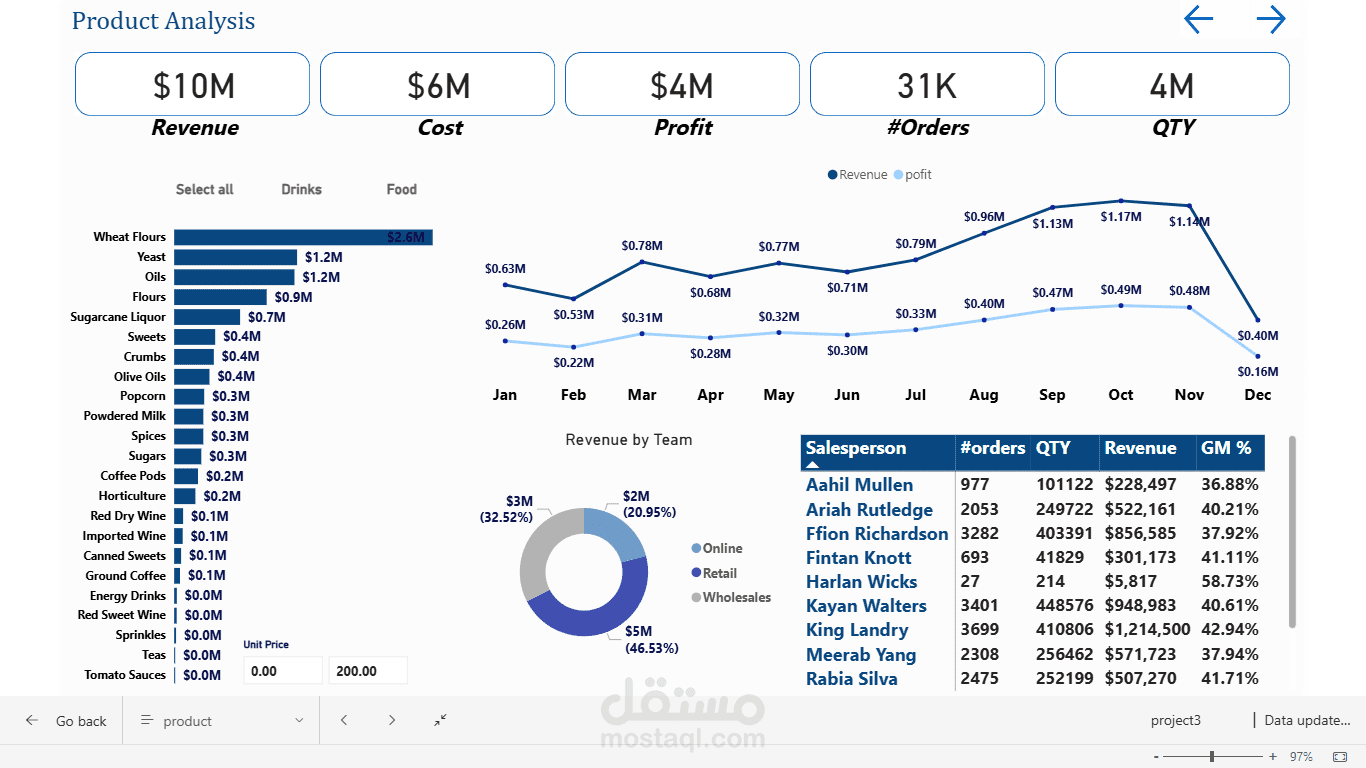
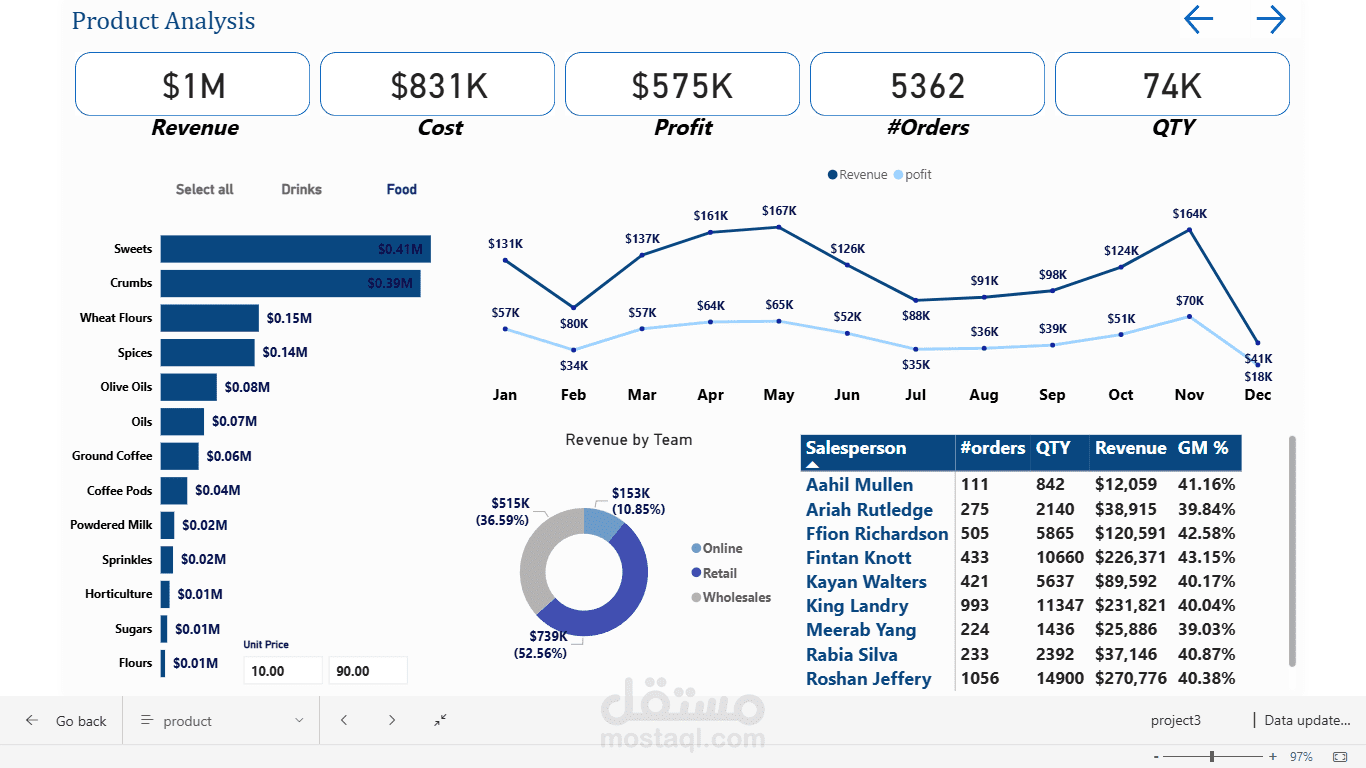
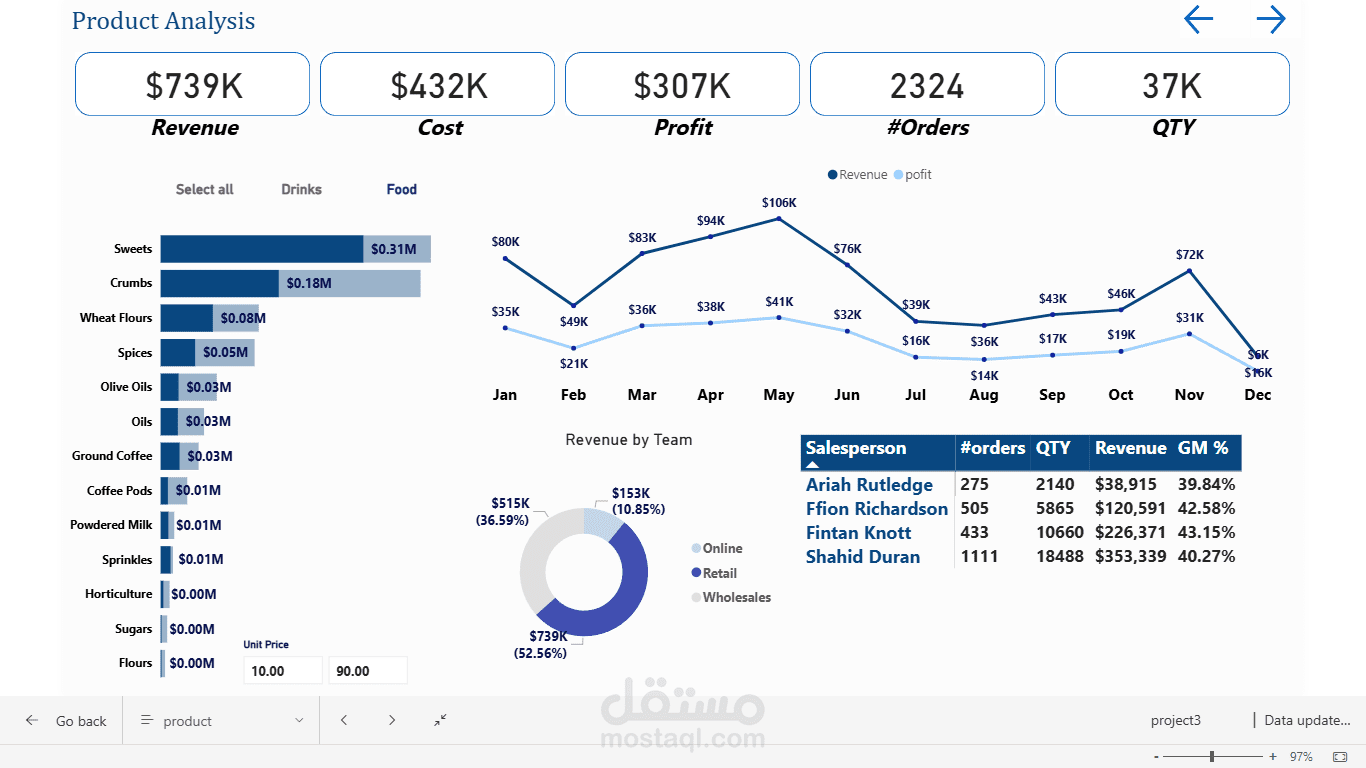
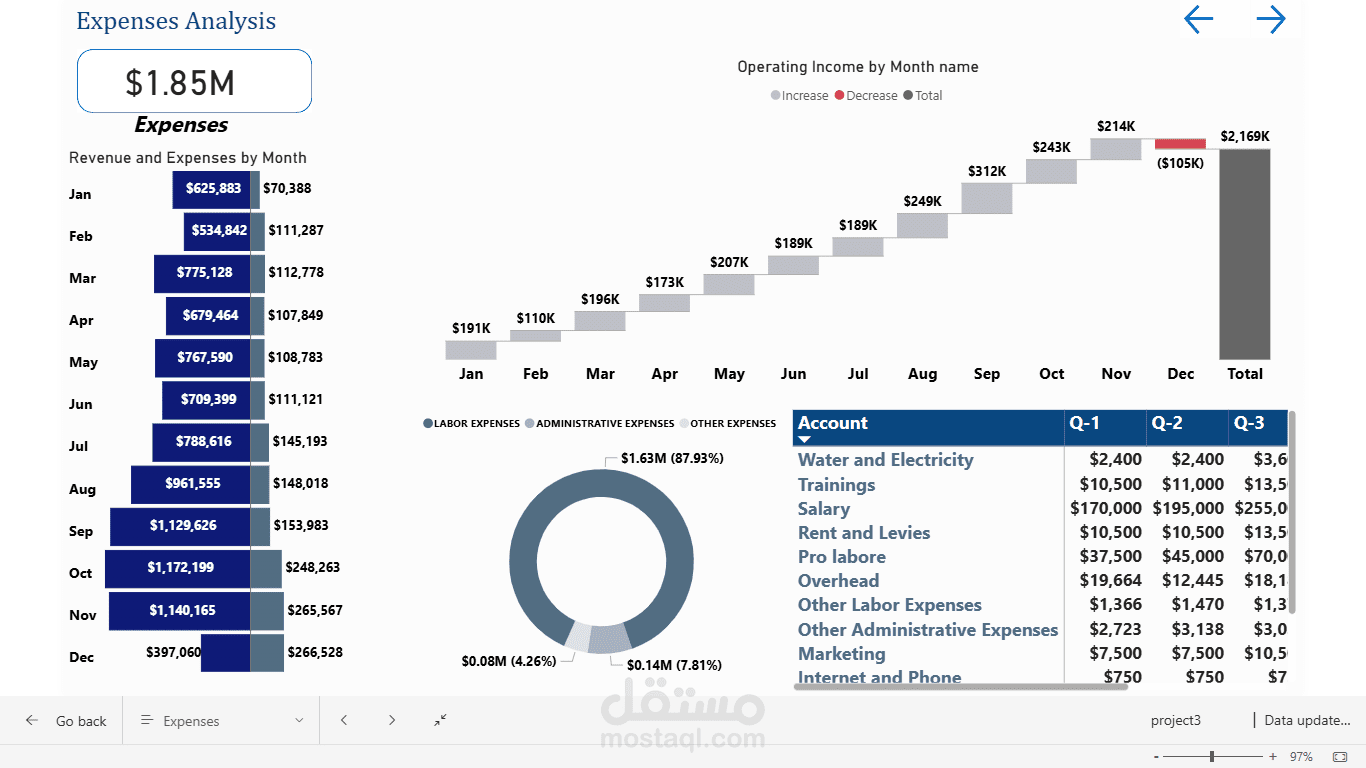
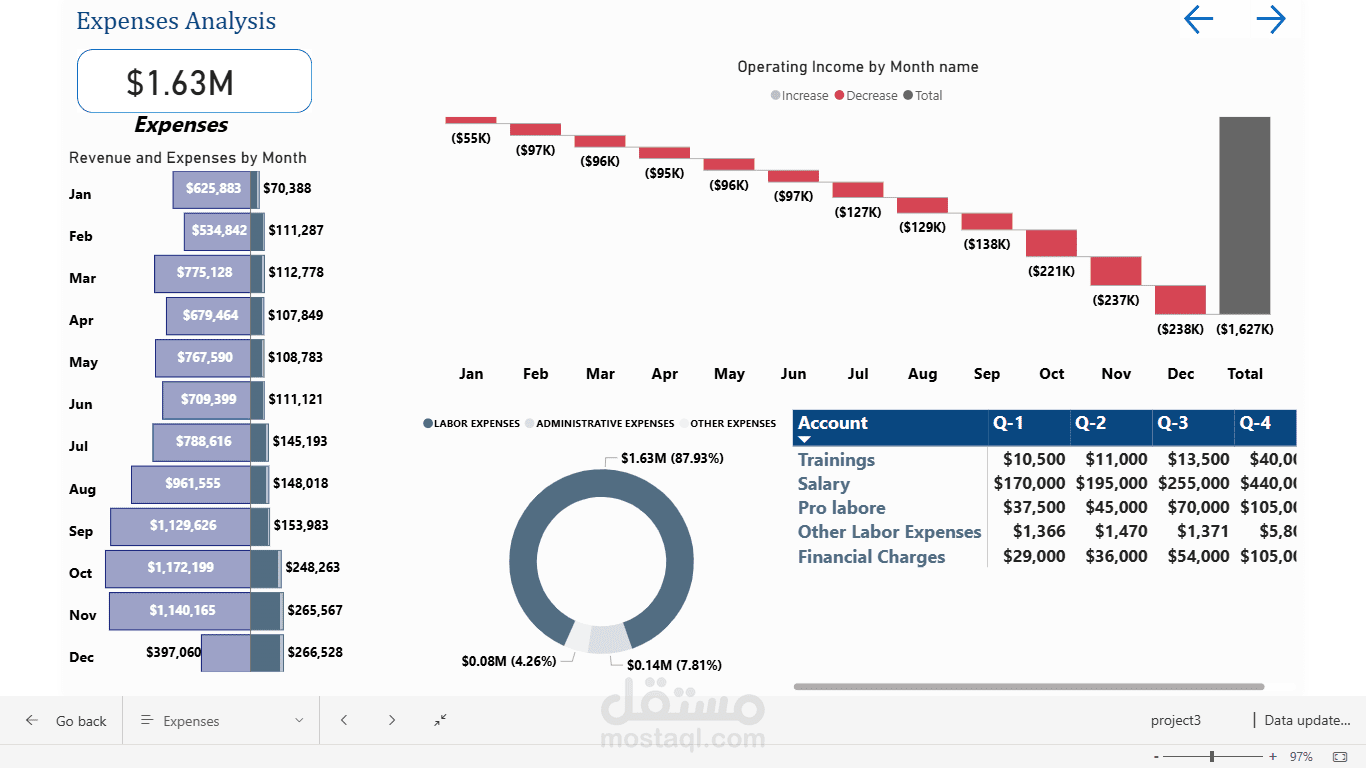
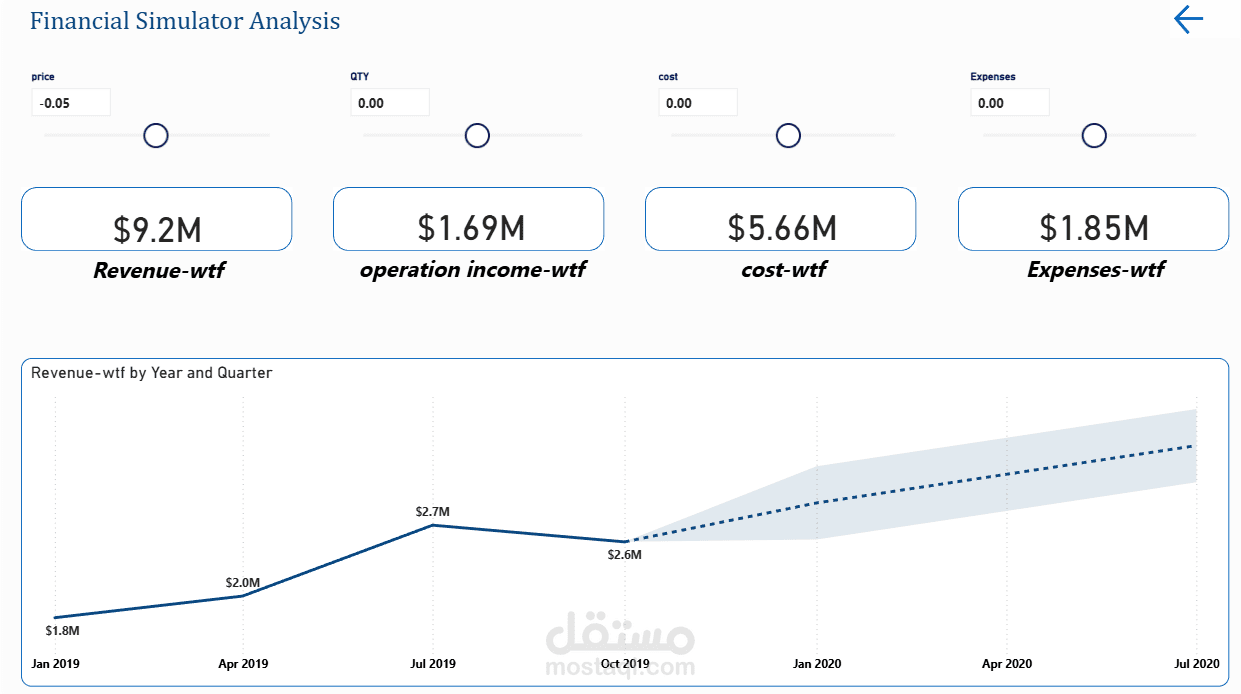
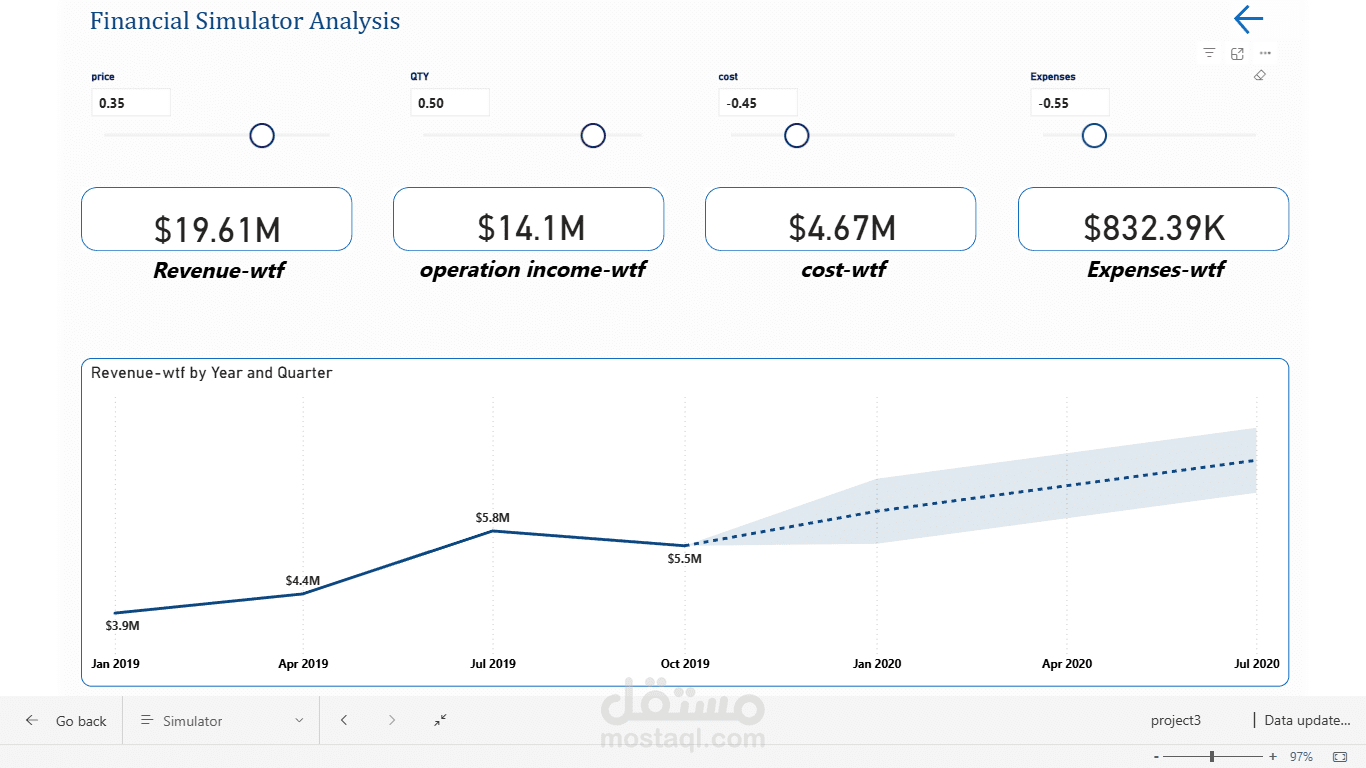
Interactive Financial Analysis & Simulator Dashboard in Power BI to help businesses make smarter, data-driven decisions.
What this dashboard delivers:
Revenue & Gross Margin tracking by month, category, supplier, and team
A What-If Simulator to test how price, cost, and quantity changes affect performance
Operating Income with detailed monthly breakdowns
Clear storytelling through bar charts, donut charts, waterfall, and KPI cards