Robo Cups Sales Analysis – Power BI Dashboard
تفاصيل العمل
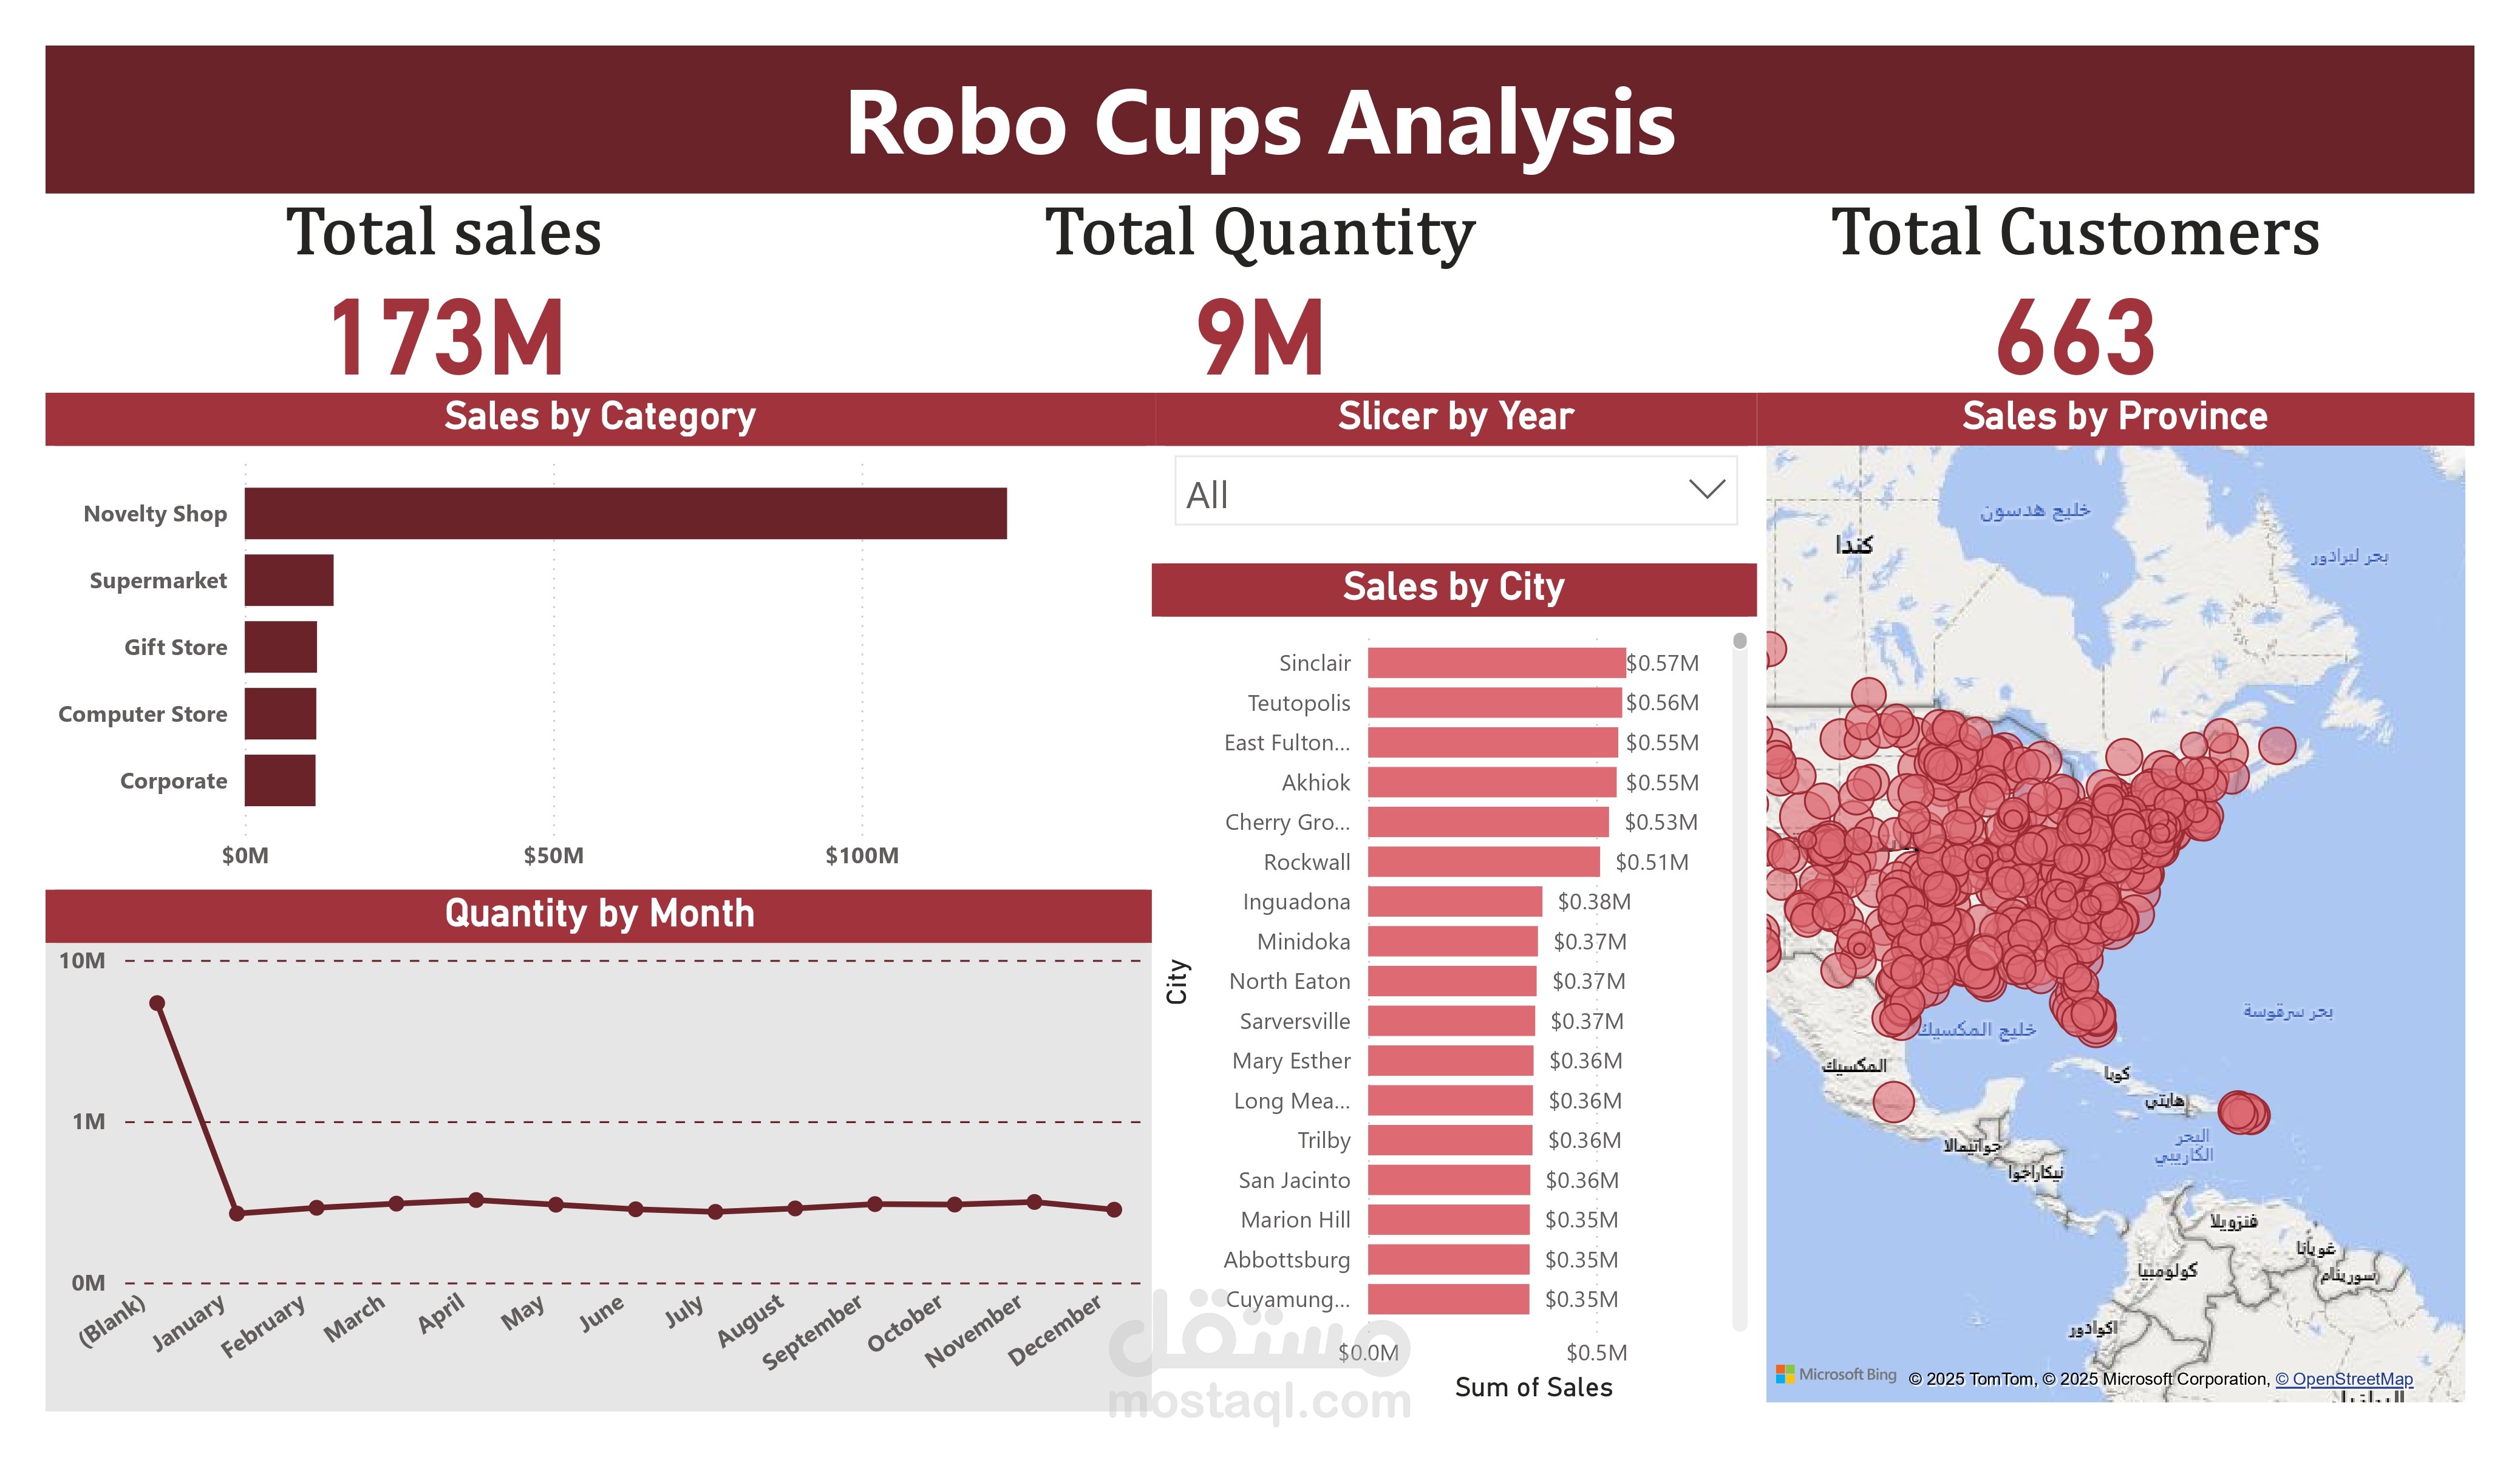
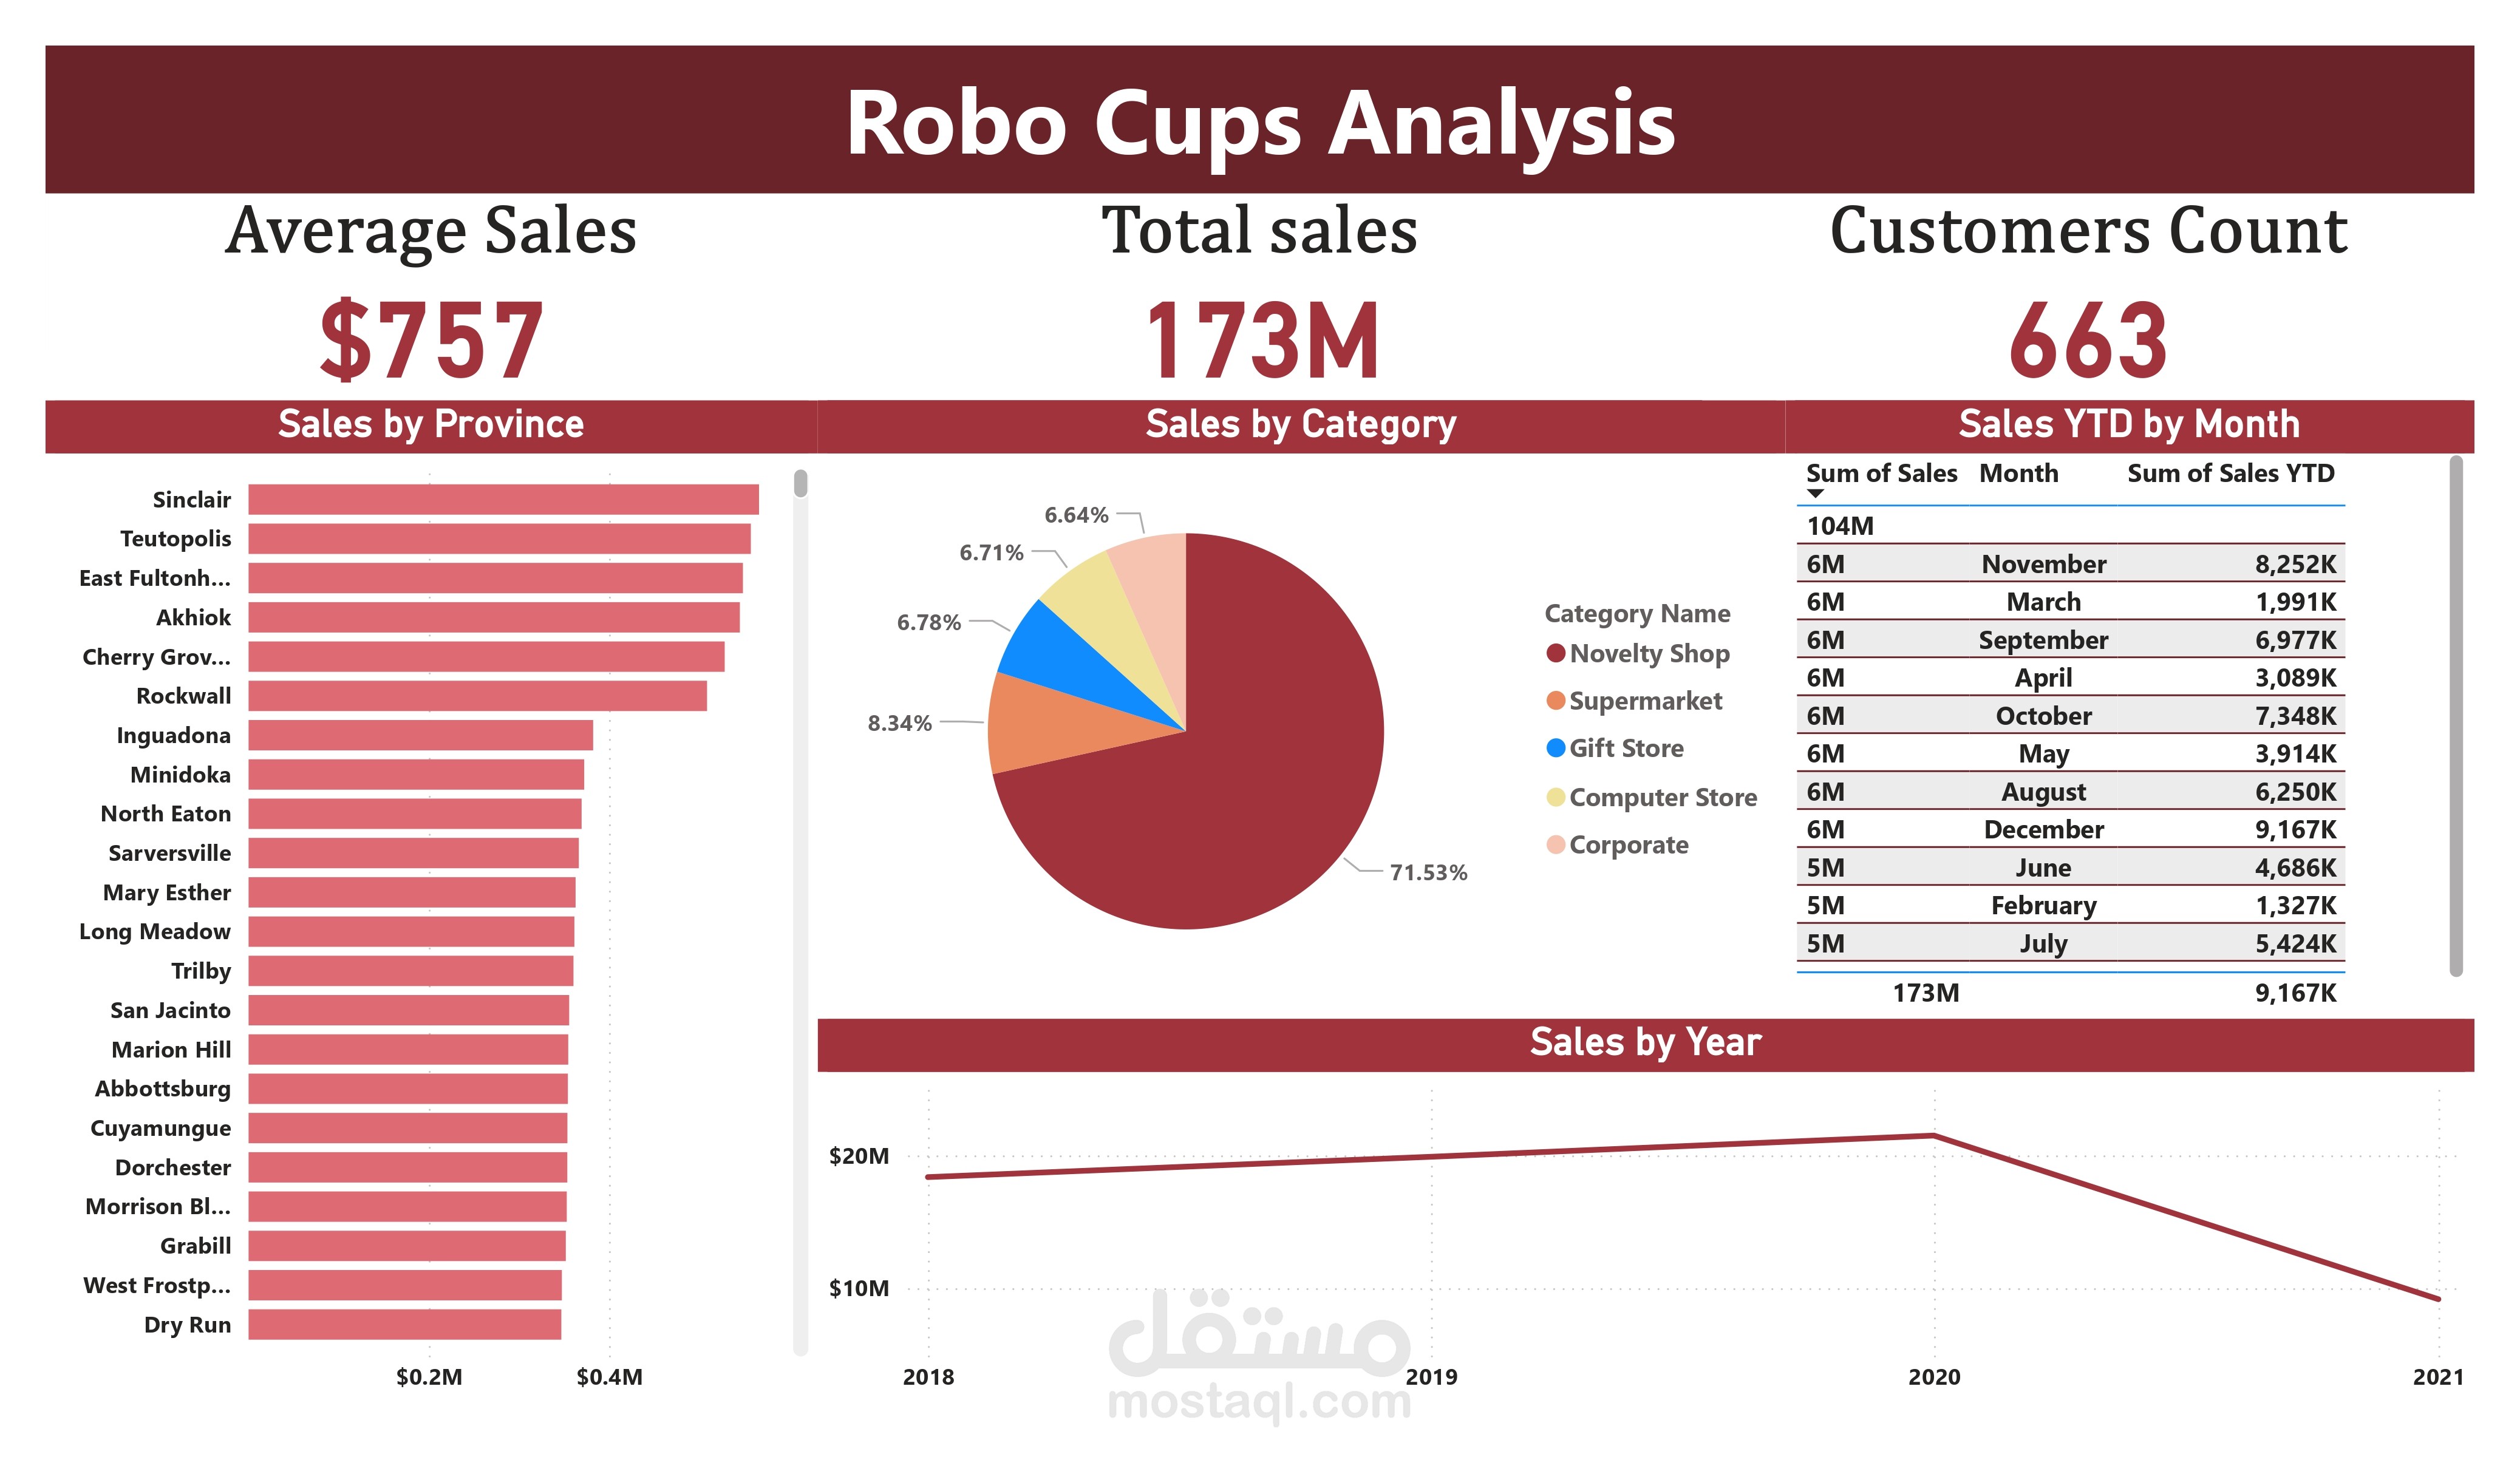
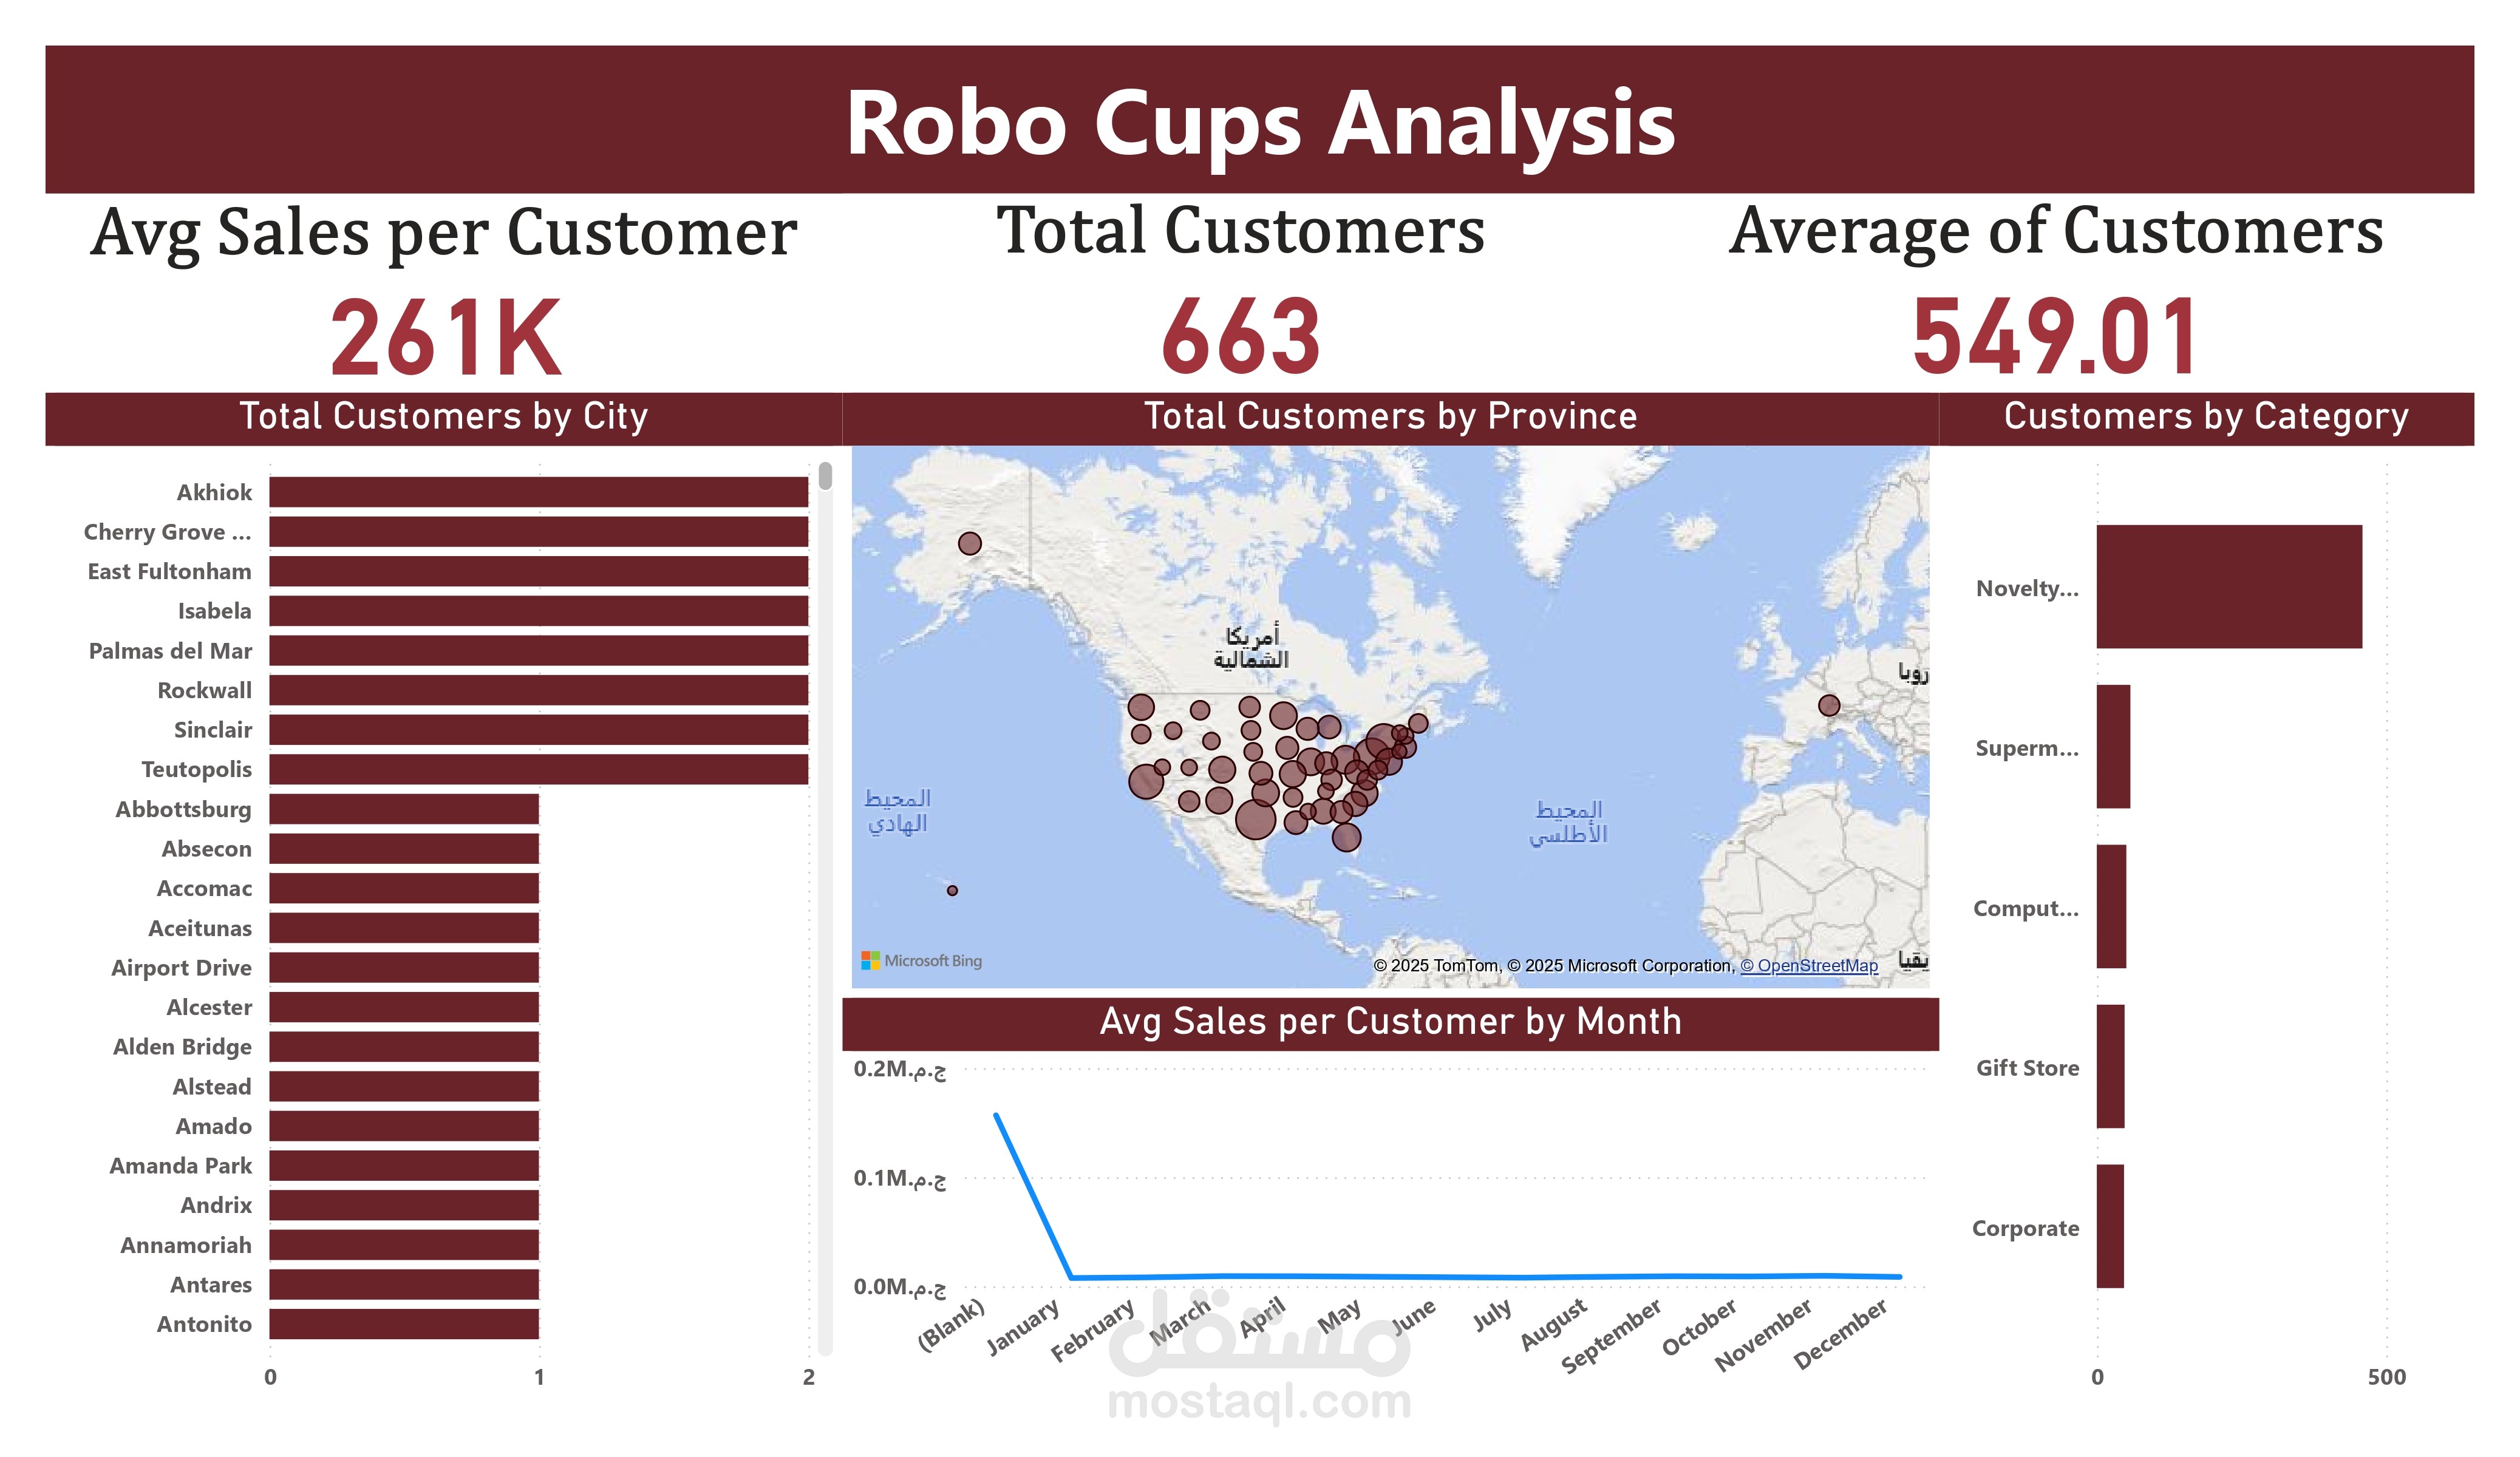
This project analyzes sales, quantity, and customer data for Robo Cups across different categories, cities, and provinces.
Key Insights:
Achieved $173M total sales, with the Novelty Shop category contributing over 70%.
Total quantity sold reached 9M units, across 663 customers.
Sales distribution showed strong performance in specific cities such as Sinclair, Teutopolis, and East Fultonia.
Year-over-Year trend indicated sales growth until 2020, followed by a decline in 2021.
Interactive dashboards allowed filtering by year, category, and region to identify top-performing markets.
Tools Used: Power BI, Data Cleaning (Excel), Data Visualization