Sales Data Analysis & Dashboard for Online Store
تفاصيل العمل
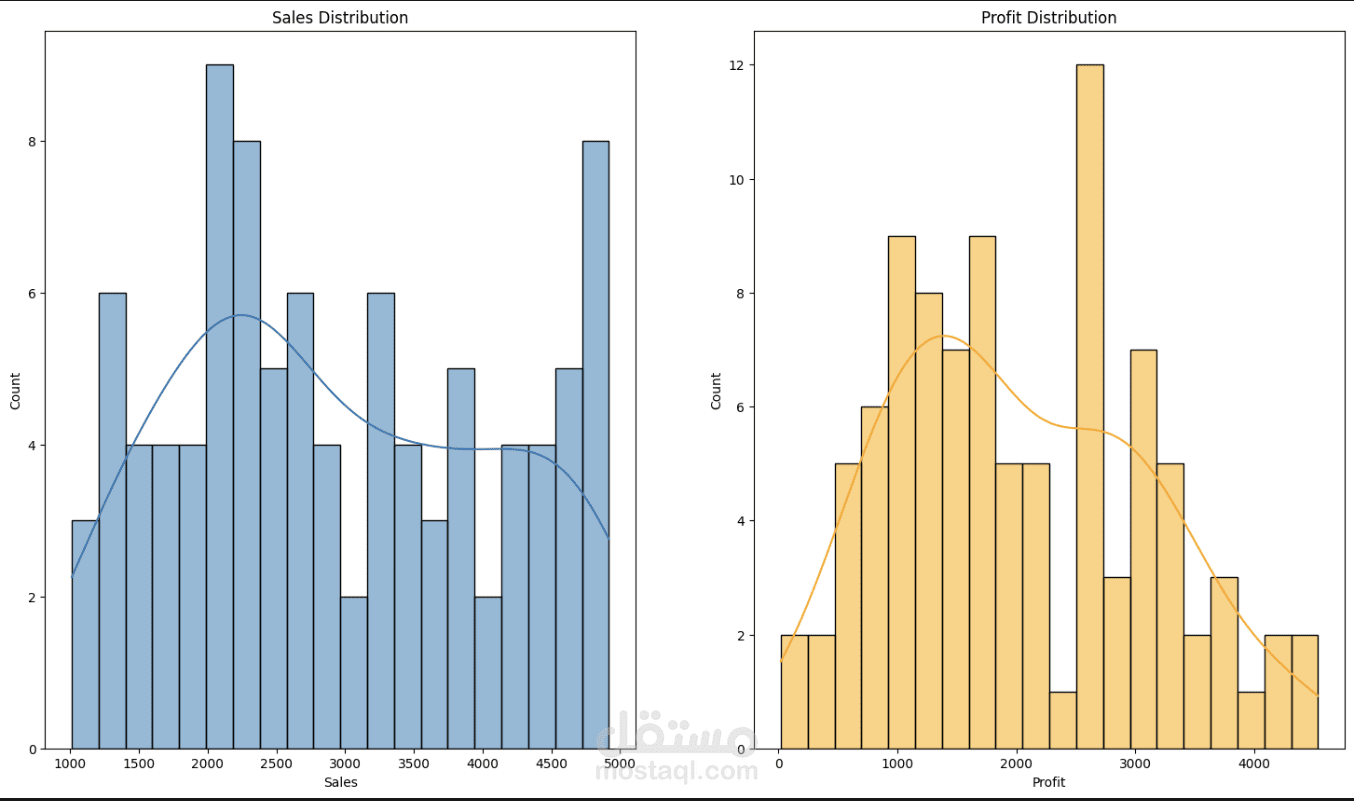
Conducted a full sales data analysis for a mock online store over 24 months.
Visualizations include:
- Monthly revenue trends
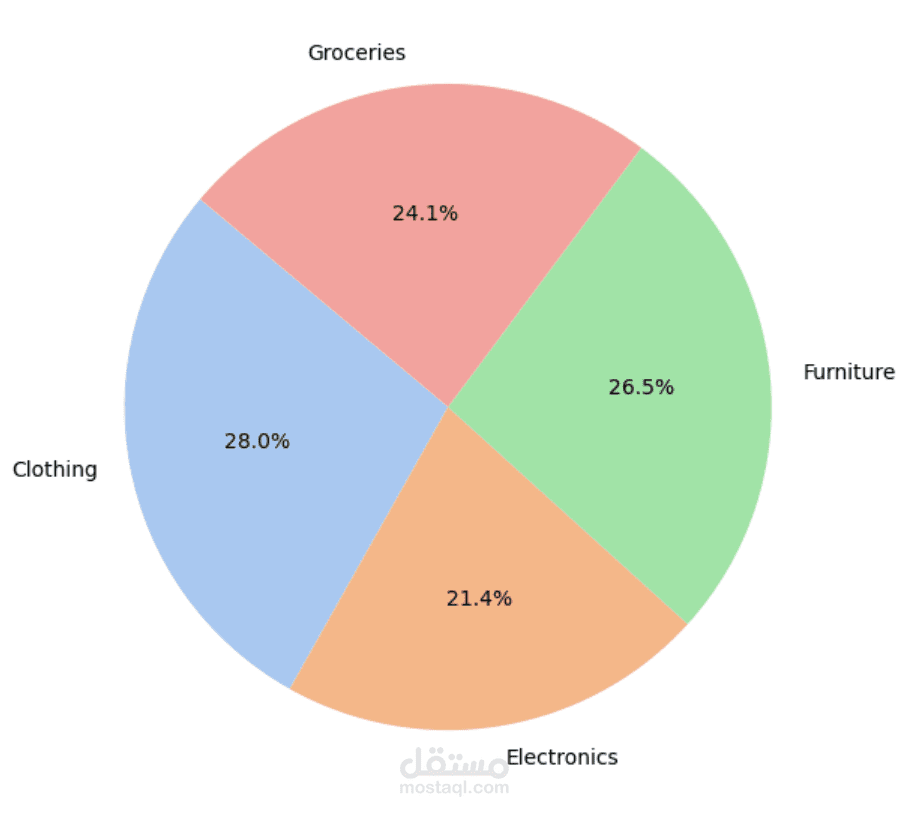
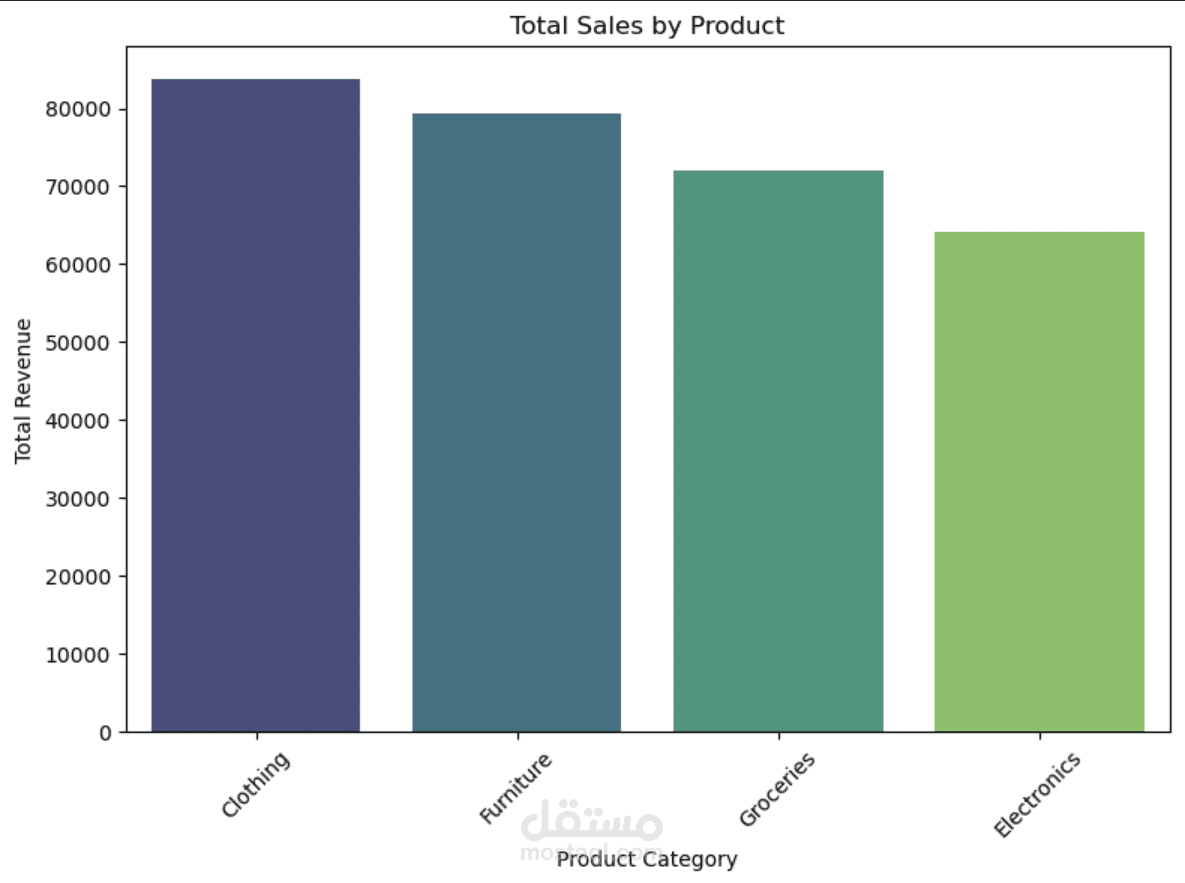
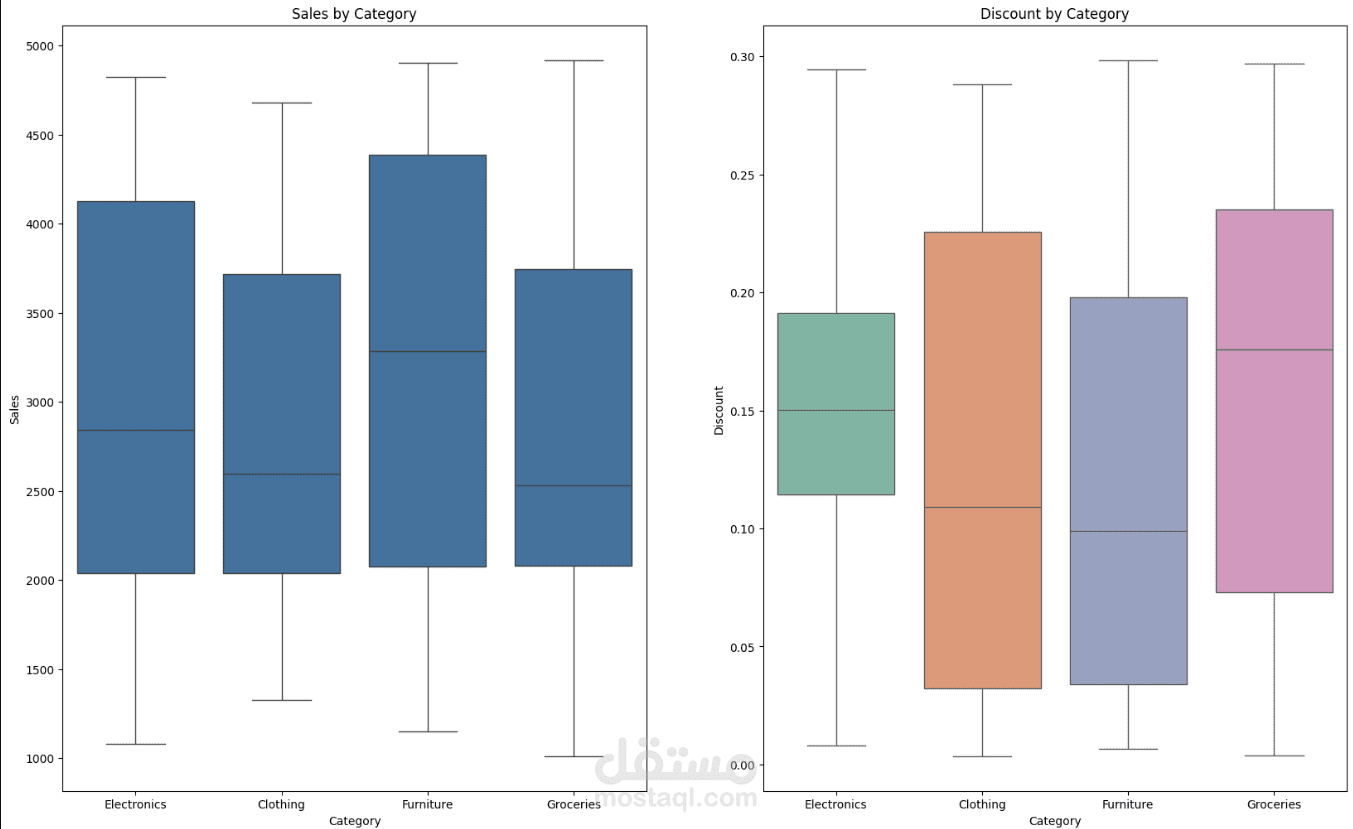
- Sales by product category
- Sales distribution pie chart
Tools used: Python (Pandas, Matplotlib, Seaborn), Jupyter Notebook