تحليل بيانات السير الذاتية في العراق
تفاصيل العمل
خلال مشروع تحليلي مستلم، قمت باستخدام برنامج Tableau لتحليل بصري ونسبي لبيانات السير الذاتية الواردة من مختلف المحافظات العراقية خلال النصف الاول من 2025.
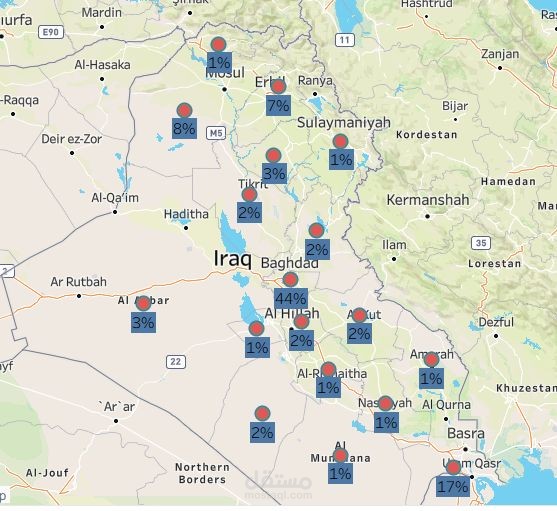
الخريطة أدناه توضح التوزيع بالنسب المئوية:
- بغداد تمثل 44% من إجمالي الطلبات
- البصرة 17%
- نينوى 8%
- أربيل 7%
- المحافظات الأخرى تتراوح بين 1% و3%
استنتجت من ذلك ان التفاعل الأعلى يتركز في بغداد والبصرة، مما يعكس التالي :
* من المحتمل وجود برامج ومبادرات توظيف نشطة في هذه المناطق، مثل معارض الوظائف، مكاتب التوظيف تكون اكثر نشاطا .
* هذه المحافظات فيها كثافة سكانية عالية، لكن حتى مع ذلك، النسبة تبقى مرتفعة مقارنة بمحافظات أخرى ذات عدد سكاني مشابه.
محافظات مثل ميسان والمثنى سجلت نسبا منخفضة، مما يشير إلى ضرورة تعزيز جهود التواصل والوصول للمجتمعات الأقل تمثيلًا.
يساعدنا مثل هذا التحليل على تصميم حملات توظيف وتدريب محلية وأكثر فاعلية للوصول لمرشحين افضل .
الأدوات المستخدمة في هذا النموذج التحليلي :
Tableau وGIS لعرض وتحليل البيانات
Excel لتنظيم وتنظيف قاعدة البيانات
As part of a recent analytical project, I used Tableau to conduct a visual and proportional analysis of CV submissions received from various provinces across Iraq during the first half of the year 2025.
The map below illustrates the percentage distribution:
Baghdad accounts for 44% of total submissions
Basra: 17%
Ninewa: 8%
Erbil: 7%
Other provinces range between 1% and 3%
From this data, I concluded that the highest engagement is concentrated in Baghdad and Basra, which may reflect the following:
These regions likely have more active employment initiatives, such as job fairs, employment centers, or private recruitment agencies.
While they are densely populated, the submission rates remain high even compared to provinces with similar population sizes.
Provinces like Maysan and Muthanna recorded low submission rates, suggesting a need to strengthen outreach efforts and improve access to underrepresented communities.
Such analysis supports the design of more localized and effective recruitment and training campaigns, helping reach and attract better-fit candidates.
Tools used in this analytical model:
Tableau and GIS for data visualization and spatial analysis-
Excel for data organization and cleaning-