NETFLIX Dashboard (Titles Analysis)
تفاصيل العمل
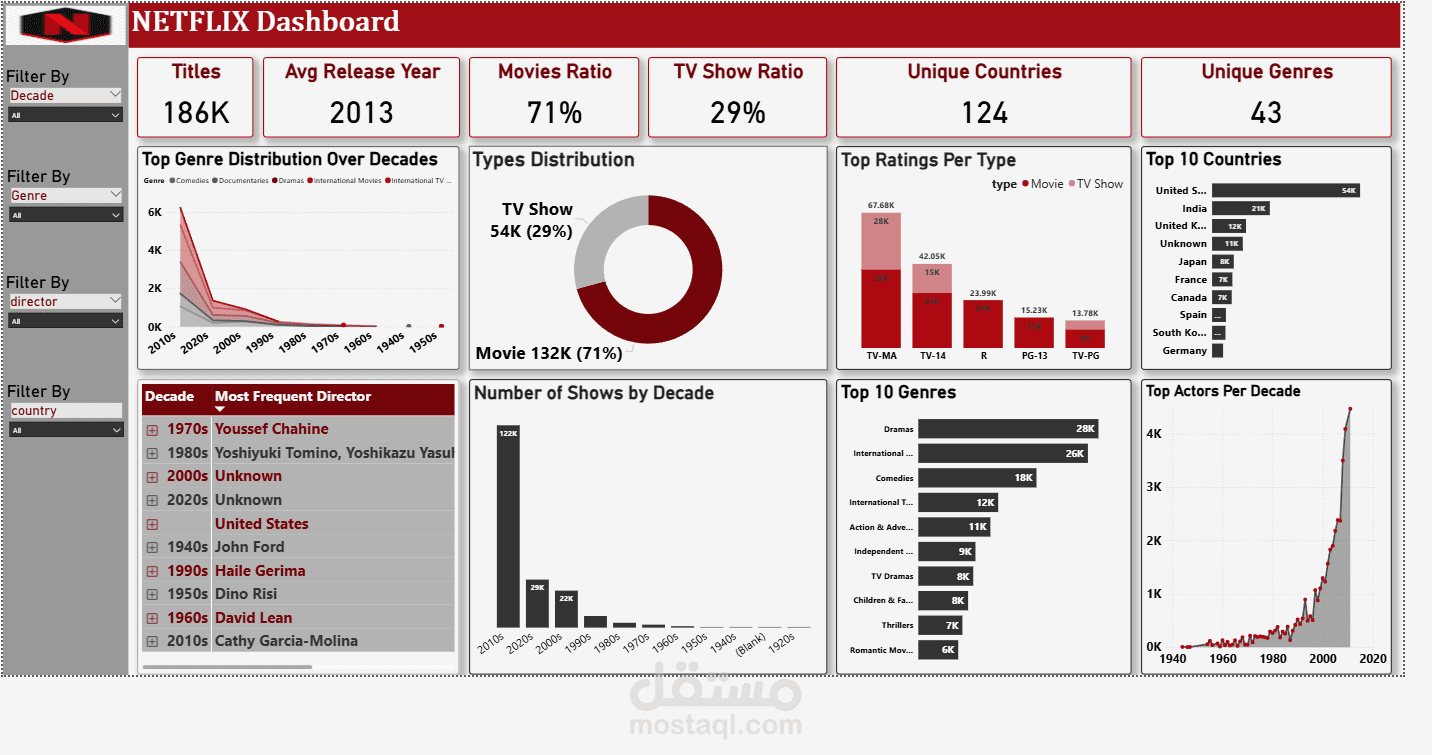
Netflix Data Analysis Dashboard
This interactive dashboard was built to explore and analyze the Netflix dataset, providing insights into the platform’s content library, production trends, and audience preferences.
Key Features:
Content Overview: Distribution of movies and TV shows by year, genre, and country.
Trends Analysis: Time-series visuals showing how Netflix’s content production has evolved over decades.
Director & Cast Insights: Identification of the most frequent directors and actors, as well as country dominance in productions.
Rating Analysis: Breakdown of content by rating categories to understand Netflix’s target audiences.
Advanced Measures: Custom KPIs such as “Most frequent director per decade” and “Top contributing countries” for deeper insights.
Tools & Technologies:
Power BI (for data modeling, visualization, and interactive filters).
Python (Pandas, Matplotlib, Seaborn, Plotly) (for preprocessing, exploration, and additional analysis).
Data Cleaning & Transformation: Handled missing values, standardized categories, and optimized dataset for performance.
Value:
This dashboard provides stakeholders with a clear, interactive, and data-driven view of Netflix’s global content strategy. It enables quick decision-making by highlighting content trends, top-performing categories, and regional insights.