Data Analysis and Visualization using Python (Pandas & Matplotlib)
تفاصيل العمل
I have completed a data analysis project using Python on the dataset tips.csv.
The project includes:
Bar Chart showing the average tip amount for each day of the week (with the highest average day identified).
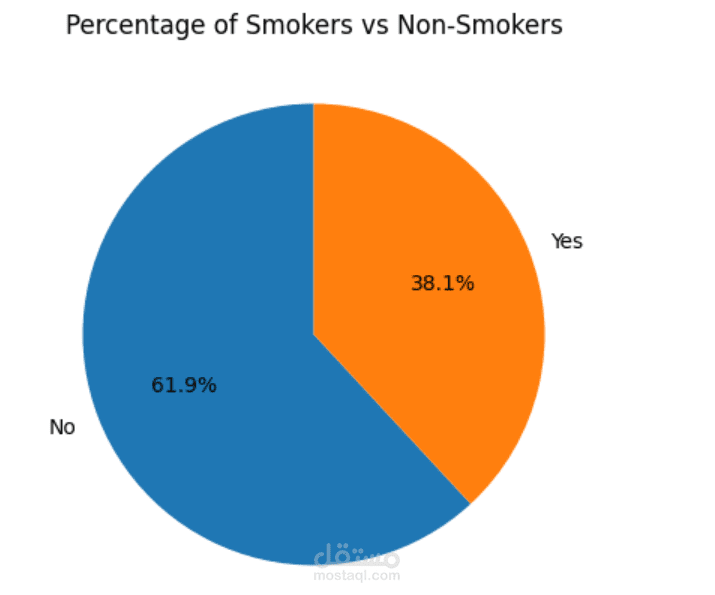
Pie Chart showing the percentage of smokers vs non-smokers.
Scatter Plot showing the relationship between total bill and tip amount.
Histogram showing the distribution of total bill amounts and identifying the most common range.
Line Chart showing the average total bill for each day of the week (with the highest day identified).
Stacked Bar Chart showing the number of smokers and non-smokers for each day.