Titanic DB
تفاصيل العمل
Problem Statement:
The classic Titanic dataset was used to practice database building, cleaning, and exploratory analysis. The objective was to organize passenger data in Excel and extract meaningful insights.
Tools Used:
Excel (Pivot Tables, Formulas, Conditional Formatting)
Analysis & Findings:
Structured the dataset into a clean Excel database, removing inconsistencies and ensuring standardized values (e.g., gender, passenger class).
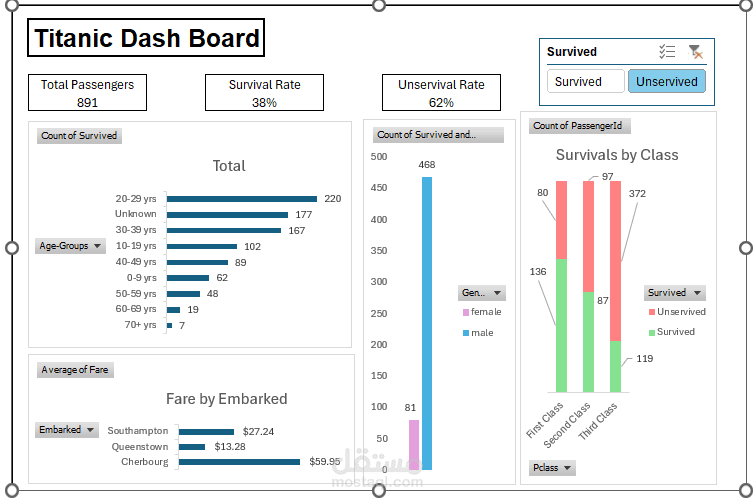
Used pivot tables to analyze survival rates by class, gender, and age group.
Highlighted key patterns: passengers in higher classes and females had significantly higher survival rates.
Outcome:
Developed strong hands-on skills in Excel for database organization, cleaning, and exploratory data analysis — skills directly transferable to client datasets.