phone search
تفاصيل العمل

The work is data analysis and cleaning, focusing on a dataset of products. The main goal is to prepare the data for analysis and build an interactive dashboard to answer key business questions.
The main features of this work include:
Data Exploration: Initial examination of the data to understand its structure and identify problems.
Data Cleaning: A meticulous process to fix errors, handle missing values, and standardize data formats to ensure accuracy.
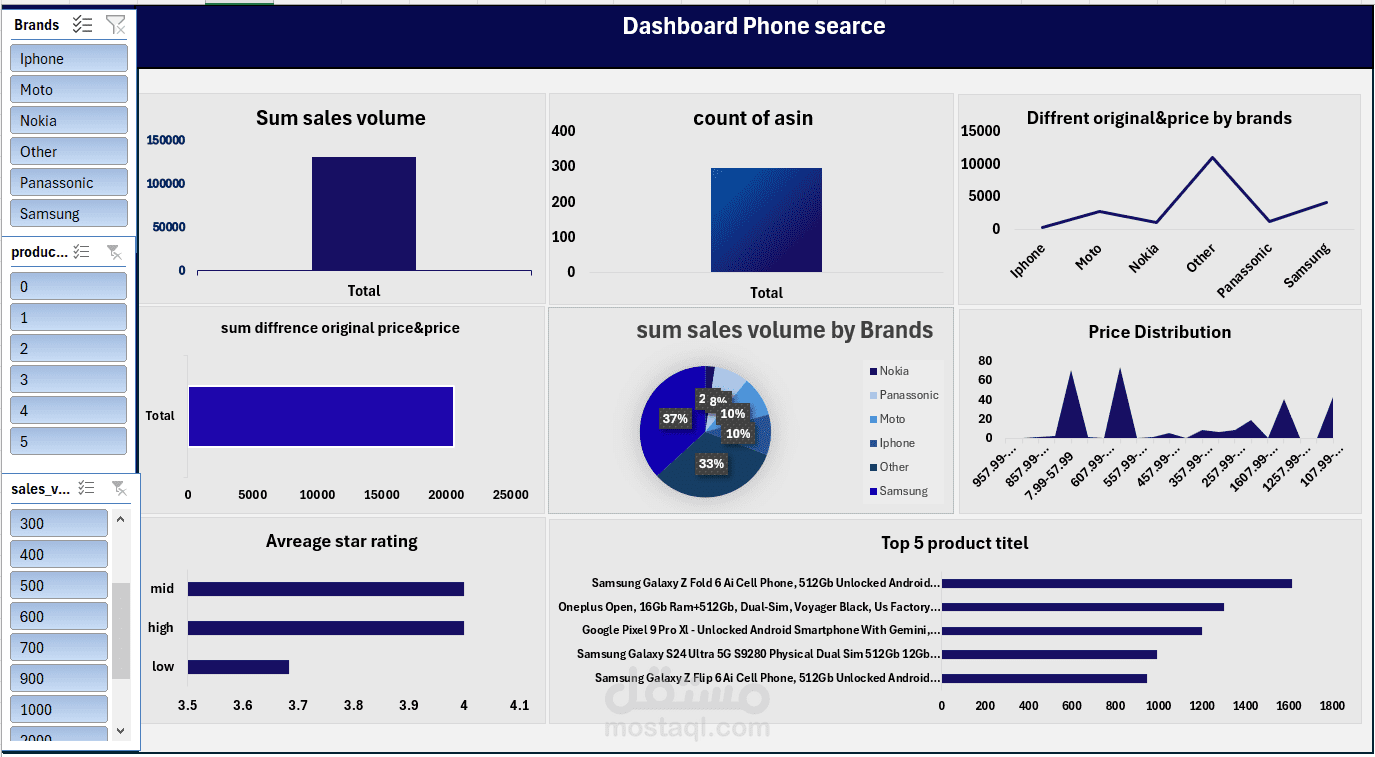
Interactive Dashboard: Creating a user-friendly dashboard that provides clear visual answers to business-critical questions, allowing for easy monitoring of key performance indicators (KPIs).
The dashboard will address the following questions:
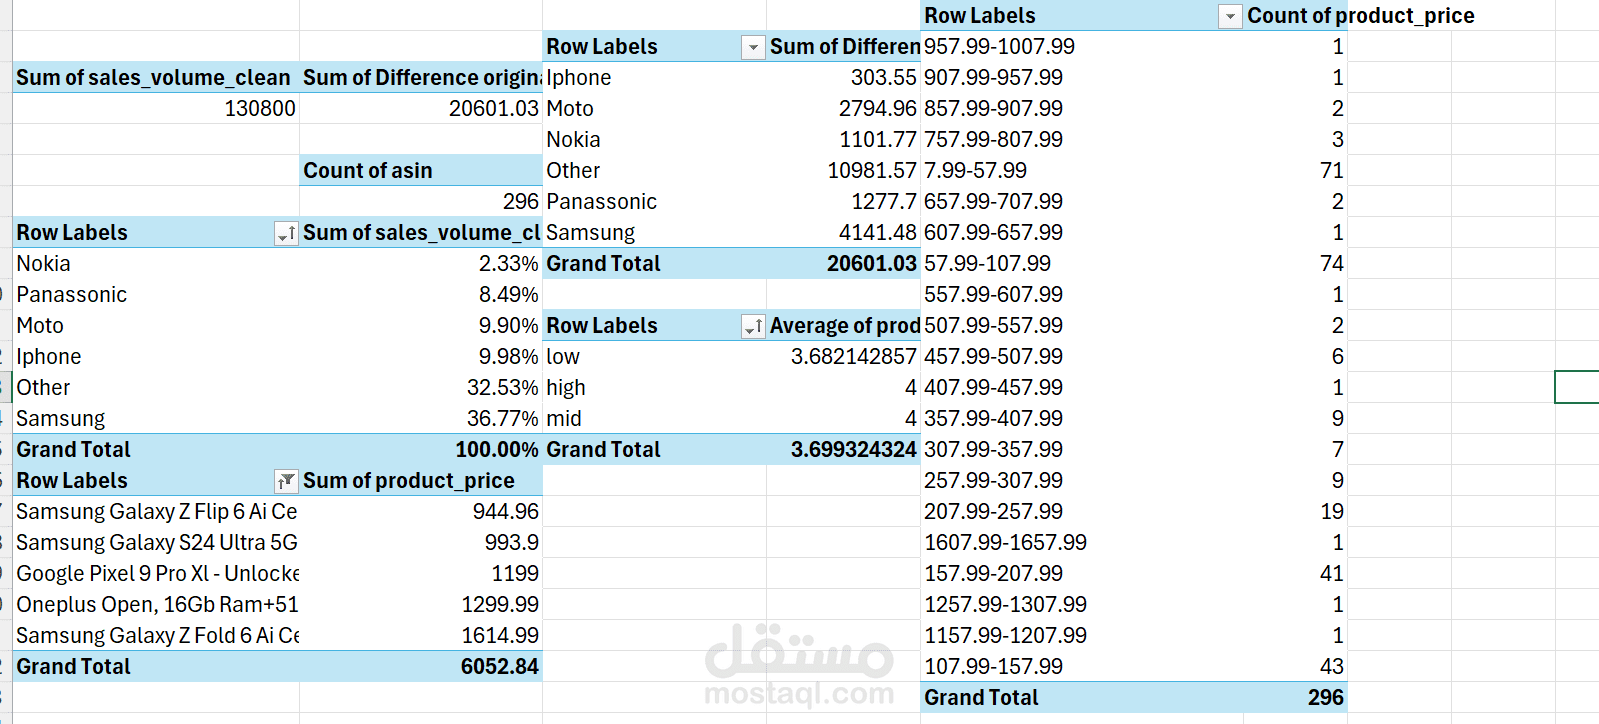
Total Sales Volume.
Total number of products.
Brand market share based on sales volume.
Difference between original price and current price.
Price distribution.
Price level by average star rating.
Top 5 products by price.
طريقة التنفيذ (Execution Methodology)
The work was carried out in a systematic way to ensure the accuracy and quality of the final output. The key steps of the methodology are:
Exploring the Data: The initial step was to thoroughly explore the raw data to understand its content and identify any issues or inconsistencies.
Data Cleaning and Transformation: This is the core part of the work, involving the following actions:
Product Titles: Standardizing text by converting it to a consistent case (e.g., capitalizing each word) and removing duplicates to create a unified format.
Numerical Columns (Product Price, Original Price): Handling missing values (nulls) by replacing them with the average of the column, and rounding decimal places to two for consistency.
Star Ratings: Correcting data type errors by splitting values based on a delimiter and replacing nulls with a zero value.
Product Offer Price: Calculating the minimum offer price by subtracting the current price from the original price, and using a conditional column to replace null values.
Brand Column: Creating a new column for brands (e.g., Samsung, iPhone, etc.) using a conditional column to categorize products.
Product Availability: The product availability column was mostly null and not needed for the calculations, so it was removed.
Sales Volume: Handling inconsistent data by replacing unknown text values with nulls, and then converting 'k' (for thousands) to '000' to prepare the data for calculations.
Price Difference: Noting and acknowledging negative values in the price difference column, which indicates a potential error in the input data where the price is higher than the original price.
Dashboard Creation: After cleaning the data, a comprehensive and interactive dashboard will be built to present the final analysis and provide a clear visual overview of the key metrics