Sales & Finance Dashboard
تفاصيل العمل
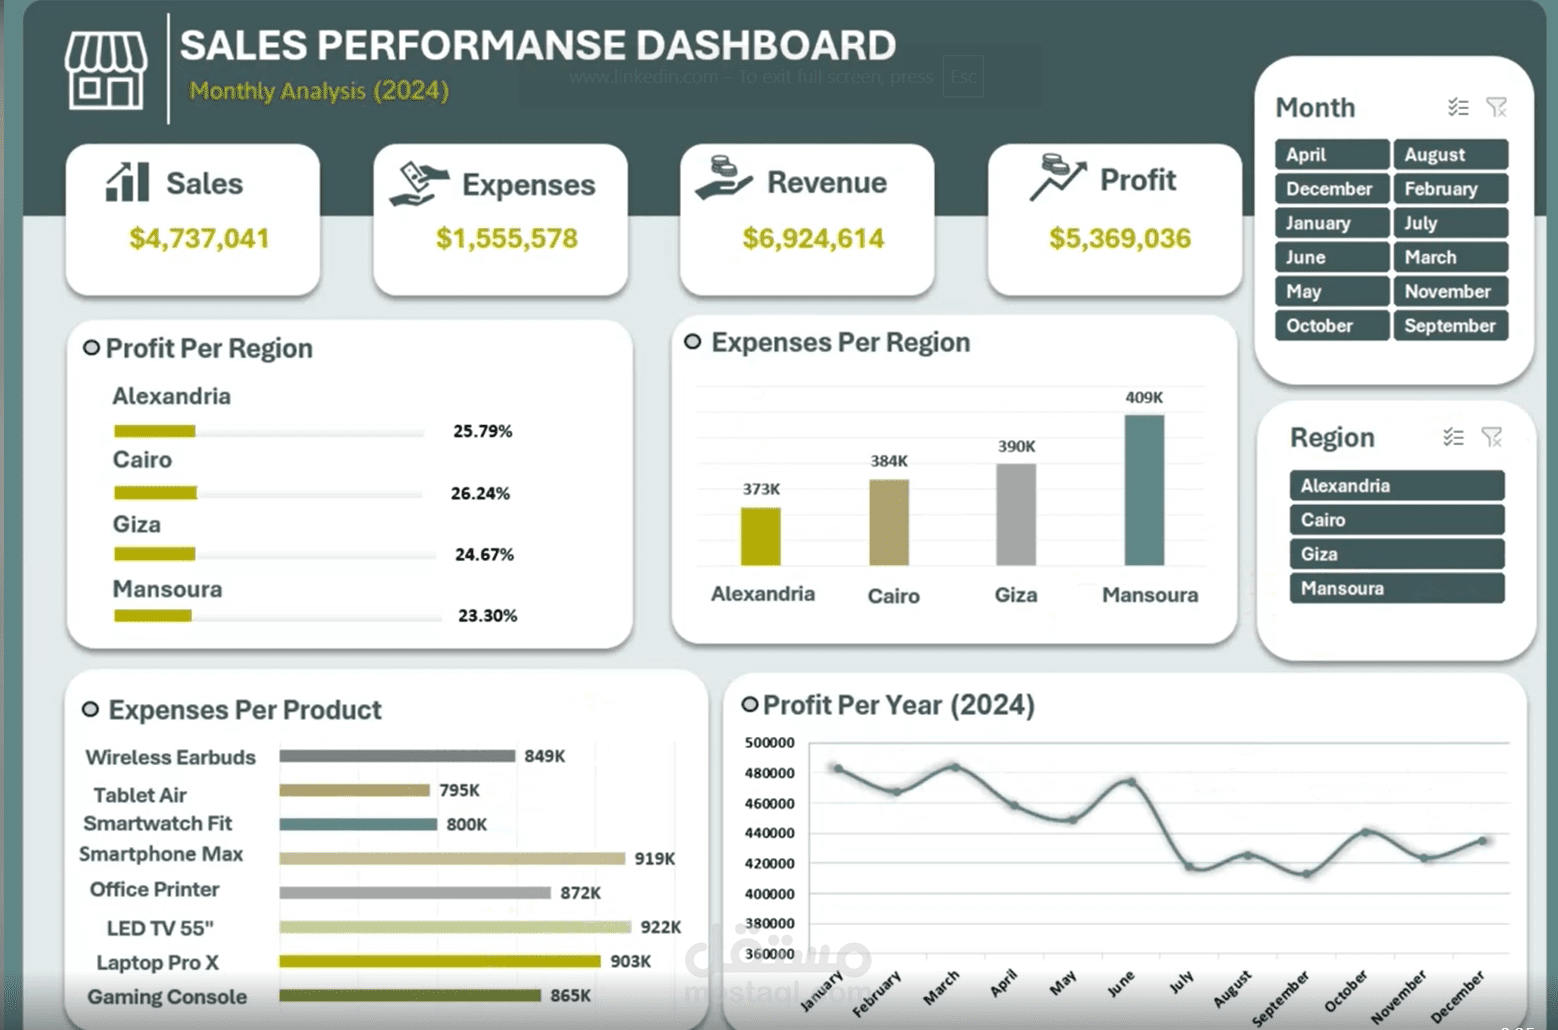
Sales & Finance Dashboard – Simple Version
Today, I’m sharing a basic dashboard I created using Excel + Pivot Tables to visualize business performance over the year.
Key insights included:
Total Sales & Revenue across the months
Comparison of Expenses vs. Profit
Performance of Top Products
Monthly interactive filters for deeper insights
This dashboard is just an initial simple version, aiming to be a first step toward organizing and visualizing the key metrics more clearly.