HR Dashboard in Excel
تفاصيل العمل
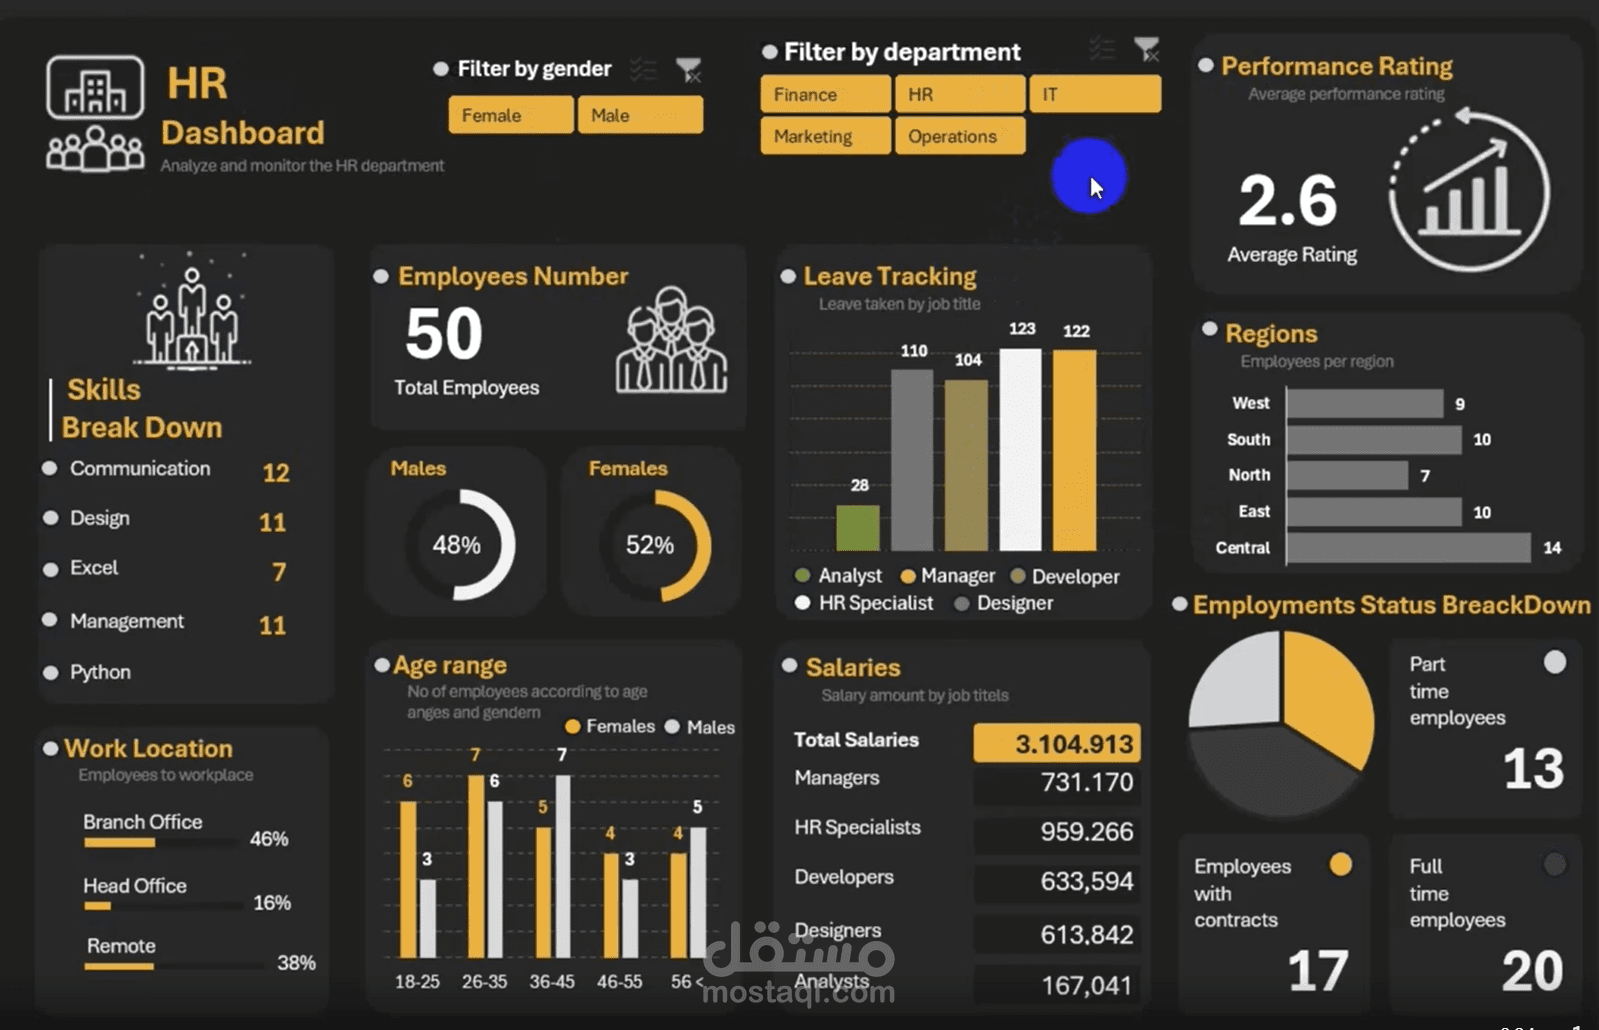
built my first HR Dashboard in Excel using Pivot Tables to turn raw HR data into clear and useful insights that support decision-making.
The dashboard highlights key metrics such as:
Total employees & gender distribution
Average performance rating
Skills breakdown
Leave tracking by job role
Salaries by position
Age group analysis
Regional & office distribution
Employment status (Full-time – Part-time – Contracts)