Sales Analytics Dashboard
تفاصيل العمل
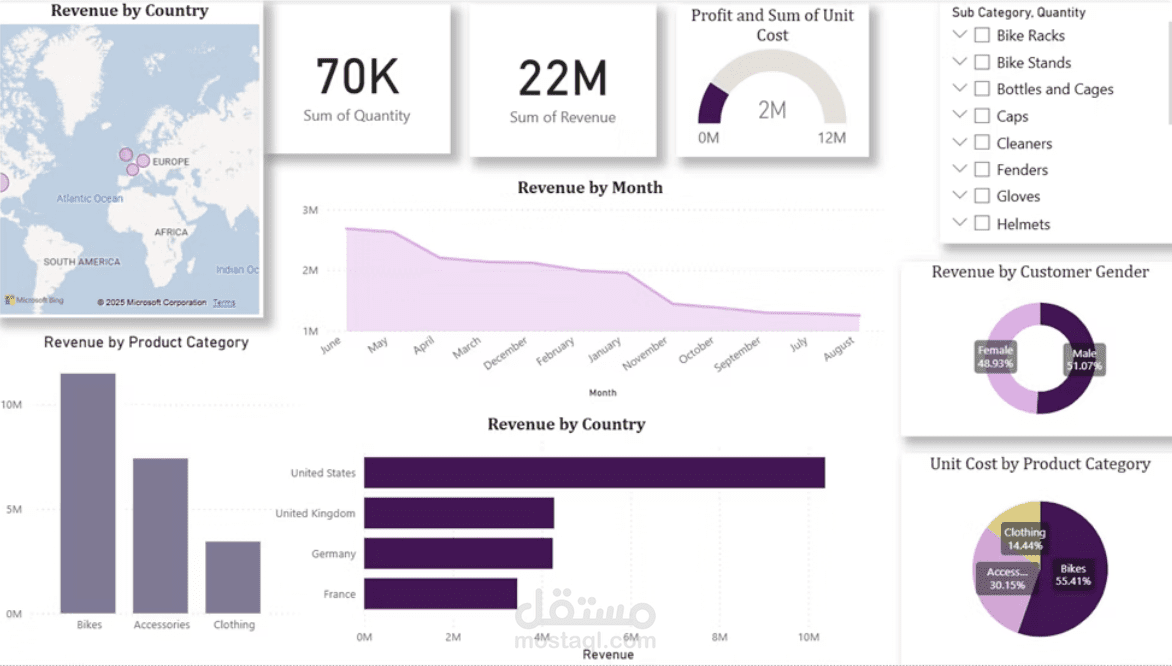
Description: Built an interactive Power BI dashboard to visualize global sales data, track KPIs, and analyze performance by product, customer gender, and region.
Technologies: Power BI, Python
Key Contributions:
Cleaned and prepared raw data using Python scripts (handled missing values, formatted dates, normalized fields). Built a star schema data model in Power BI for optimized performance. Designed interactive visuals: bar charts, donut charts, line graphs, gauge, map. Implemented drill-through filters and dynamic slicers by product sub-category, gender, and country.
Methodology: Cleaned data using Python, built a star schema model in Power BI, designed intuitive visuals, and added interactive features like slicers and drill-through filters.
Results: Delivered an interactive dashboard that revealed top-performing segments, enabled demographic and regional comparisons, and supported data-driven decision-making.
Code/Demo: https://github.com/samaat...