data analyst
تفاصيل العمل
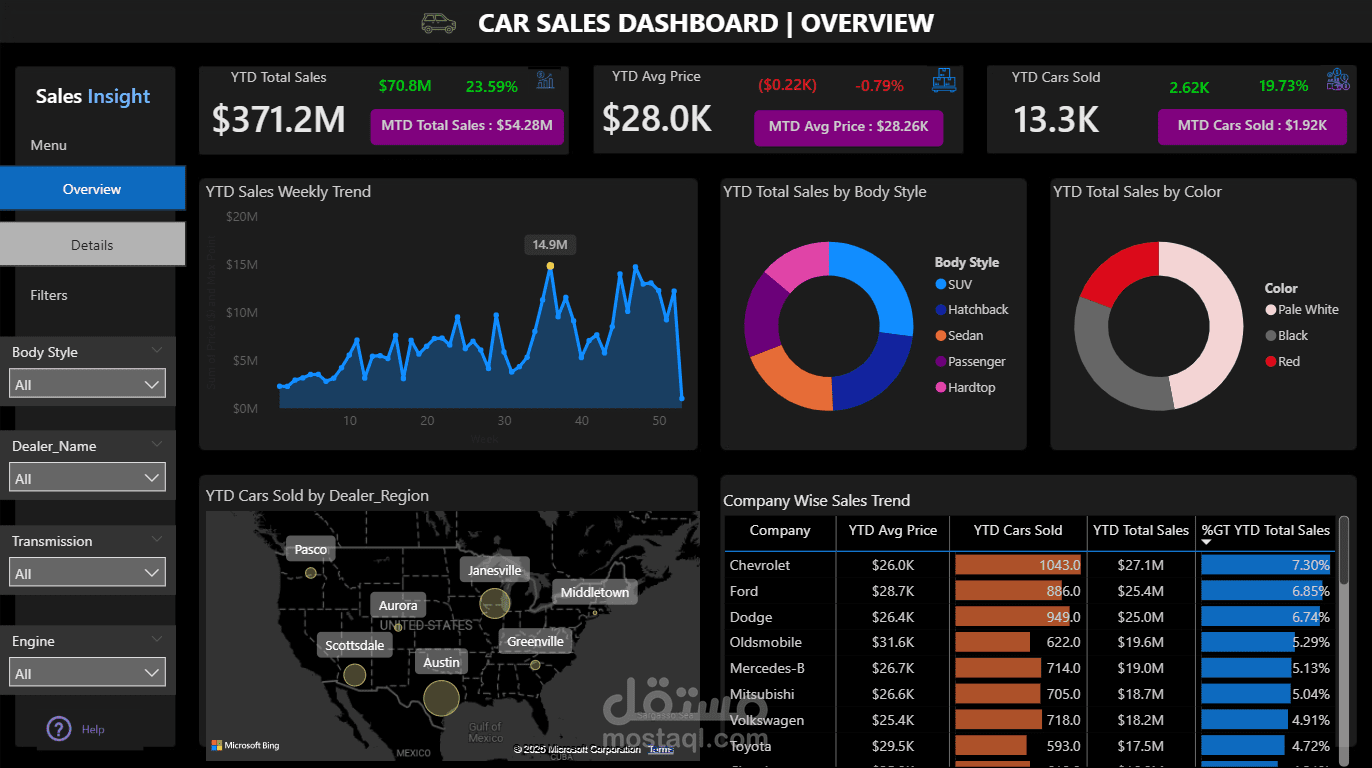
I worked with my team to develop a Car Sales Dashboard designed to manage and analyze automotive sales data. The goal of the project was to create an interactive and user-friendly tool that enables companies to track sales performance in real time and make data-driven decisions.
Key Features
Interactive Dashboard: Displays key performance indicators such as total sales, average selling price, and number of cars sold.
Advanced Analytics: Includes visual charts showing weekly sales trends, sales distribution by body style, and by car color.
Dynamic Filters: Users can filter results by body style, dealer name, transmission type, and engine.
Geographical Insights: Interactive map to visualize sales by region.
Company-Wise Comparison: Sales trend analysis by car manufacturer with market share insights.
Technologies Used
Power BI / Tableau for dashboard design
Excel / SQL Server for data preparation and integration
Data visualization and reporting tools
Outcome
The project provided a comprehensive and accurate view of sales performance, helping managers and decision-makers identify strengths and weaknesses, and plan more effective business strategies.