Summary Test Report
تفاصيل العمل
Structure of the Document
Cover Page
Title: Summary Test Report
Fields for: Project Name, Release, Test Environment, Prepared By, and Date.
Acts as the front page for any formal report.
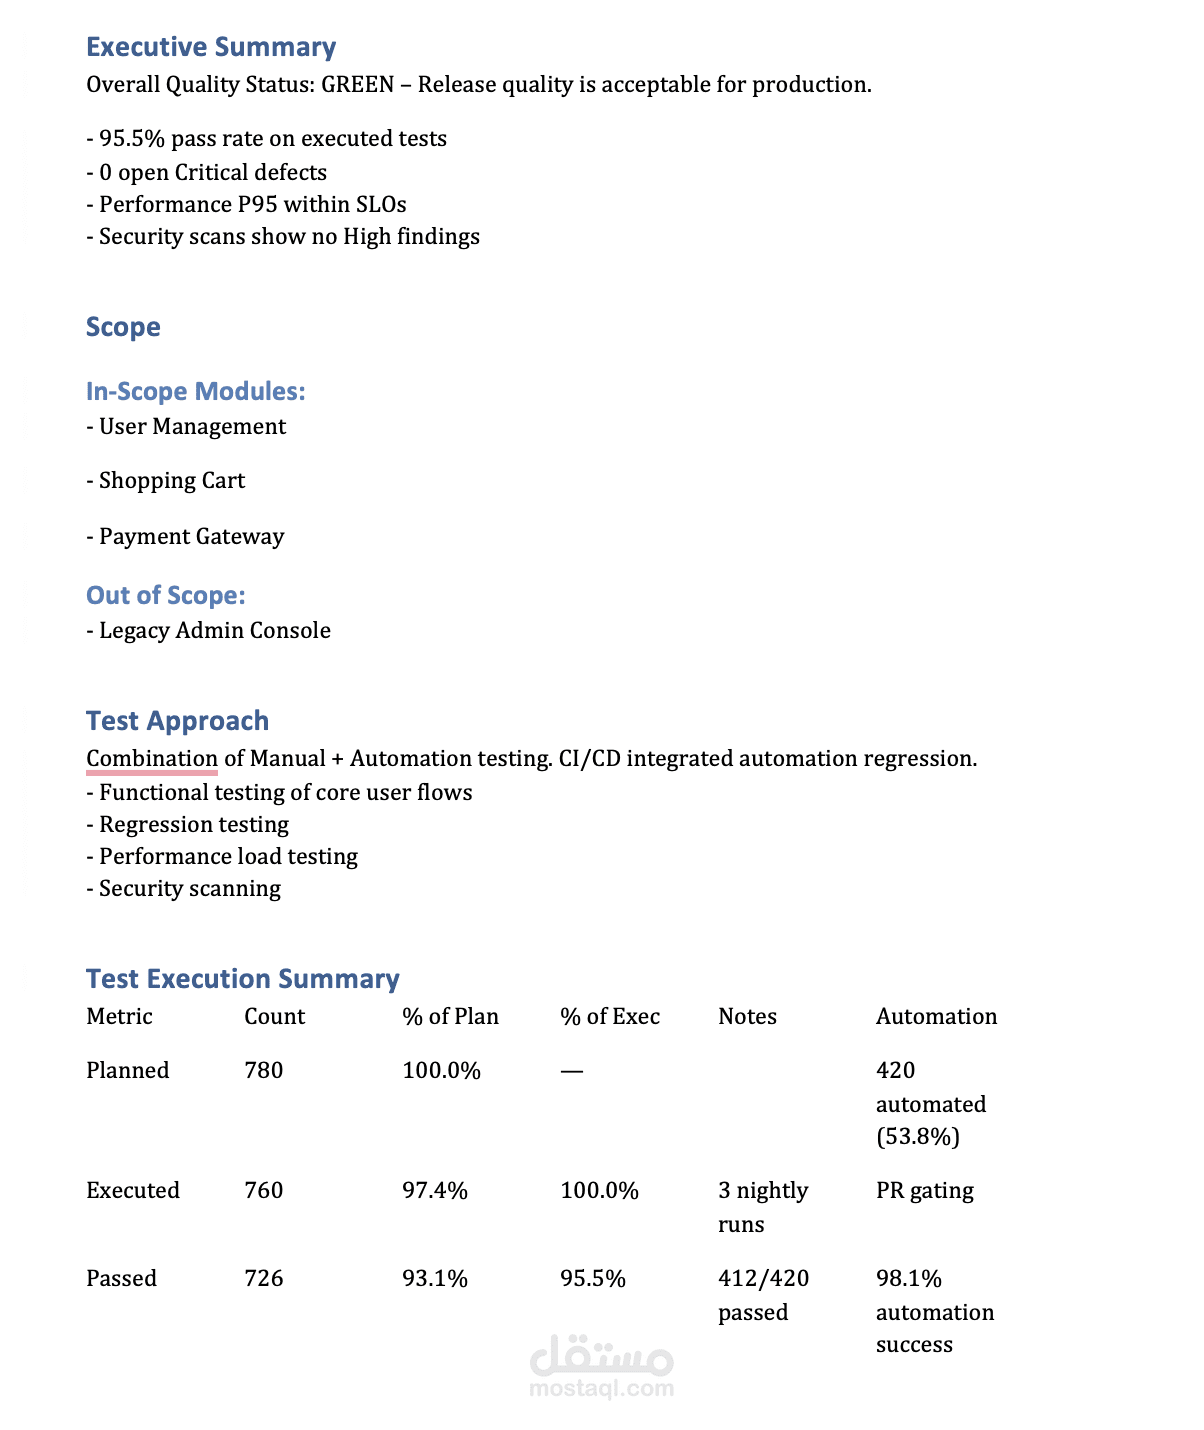
Executive Summary
High-level quality status shown as GREEN.
Key points:
95.5% pass rate on executed tests.
0 open critical defects.
Performance within agreed Service Level Objectives (SLOs).
No high security findings.
Scope
In-Scope Modules: User Management, Shopping Cart, Payment Gateway.
Out of Scope: Legacy Admin Console.
Test Approach
Explains the testing mix: Manual + Automation.
Includes functional, regression, performance, and security testing.
Test Execution Summary
A table showing: Planned, Executed, and Passed test cases.
Metrics include counts, percentages, notes, and automation coverage.
Defect Summary
Table of open defects categorized by severity (Critical, High, Medium, Low).
Example: Critical = 0, High = 2, Medium = 5, Low = 12.
Risks & Mitigations
Example: Risk of limited edge-case data, mitigated by synthetic data generation.
Performance Snapshot
Example: 95th percentile response time < 1.2s under 500 concurrent users.
Security Summary
Results of DAST/SAST scans: no Critical or High issues, 3 Medium issues pending fix.
GO / NO-GO Decision
Recommendation: GO for Production deployment.
Appendices
Placeholders for links to full test cases, defect dashboard, and performance results.
Purpose
This document is a formal summary report used at the end of testing cycles or before production releases.
It helps management and stakeholders quickly understand:
Quality status
Defect health
Performance and security results
Overall release readiness