clothing dashboard
تفاصيل العمل
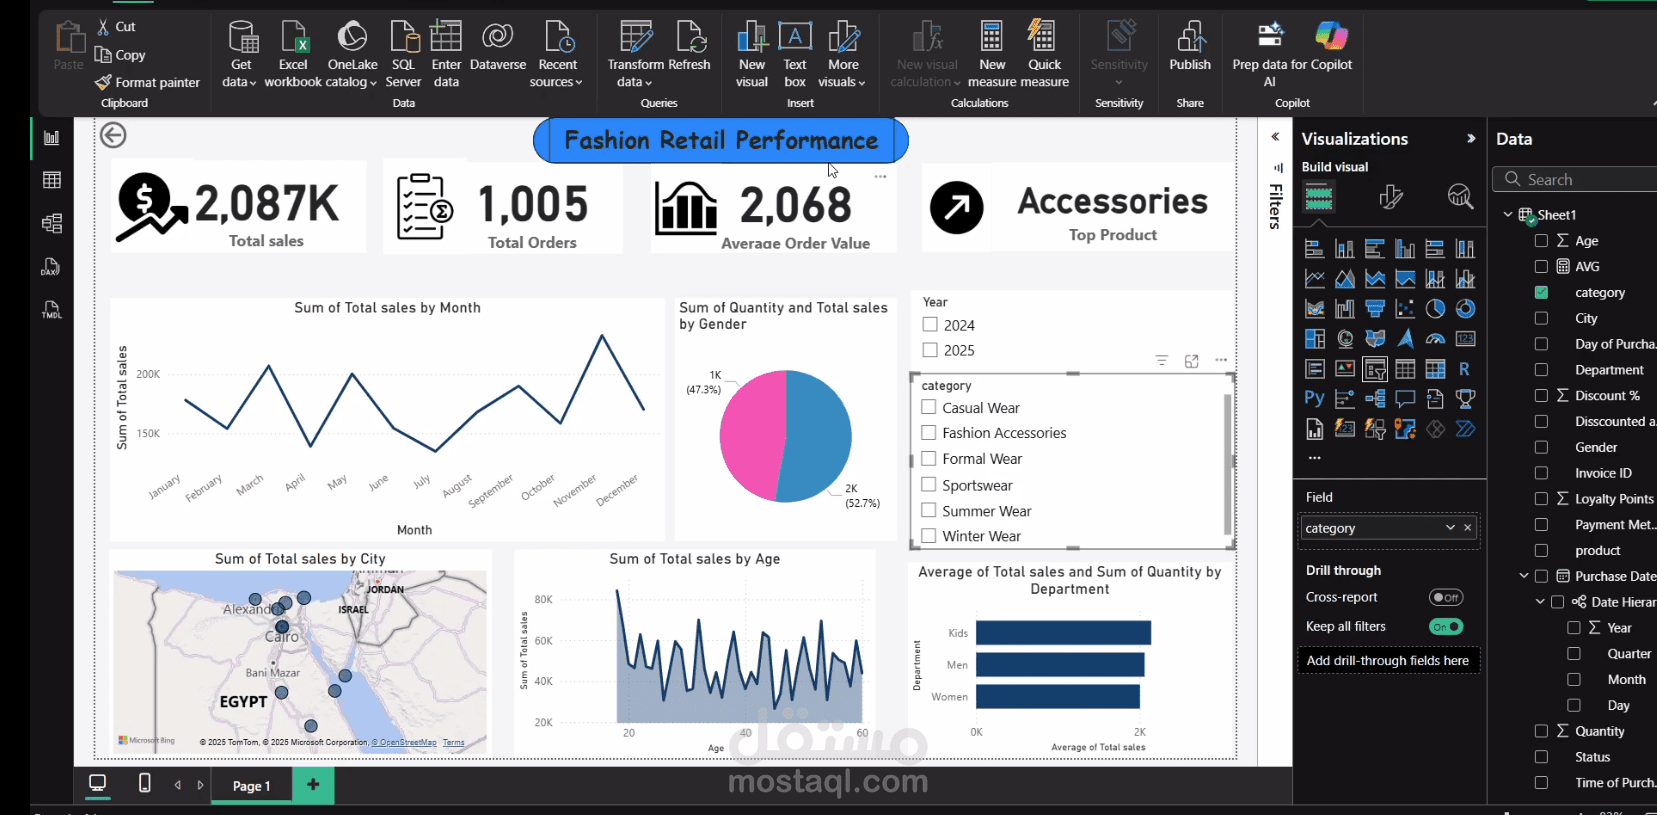
Excited to share my first Power BI project!
I started this project by cleaning and preparing the raw sales data, then I built an interactive dashboard to analyze clothing sales performance.
The dashboard includes:
Total Sales
Total Orders
Average Order Value
Top Product
Sales by Month, City, Department, and Gender.
I kept the design simple and clean — I’m not a big fan of too many colors ?. My main focus was to deliver insights clearly and professionally for decision-making.