Bikes Sales Dashboard in Excel
تفاصيل العمل
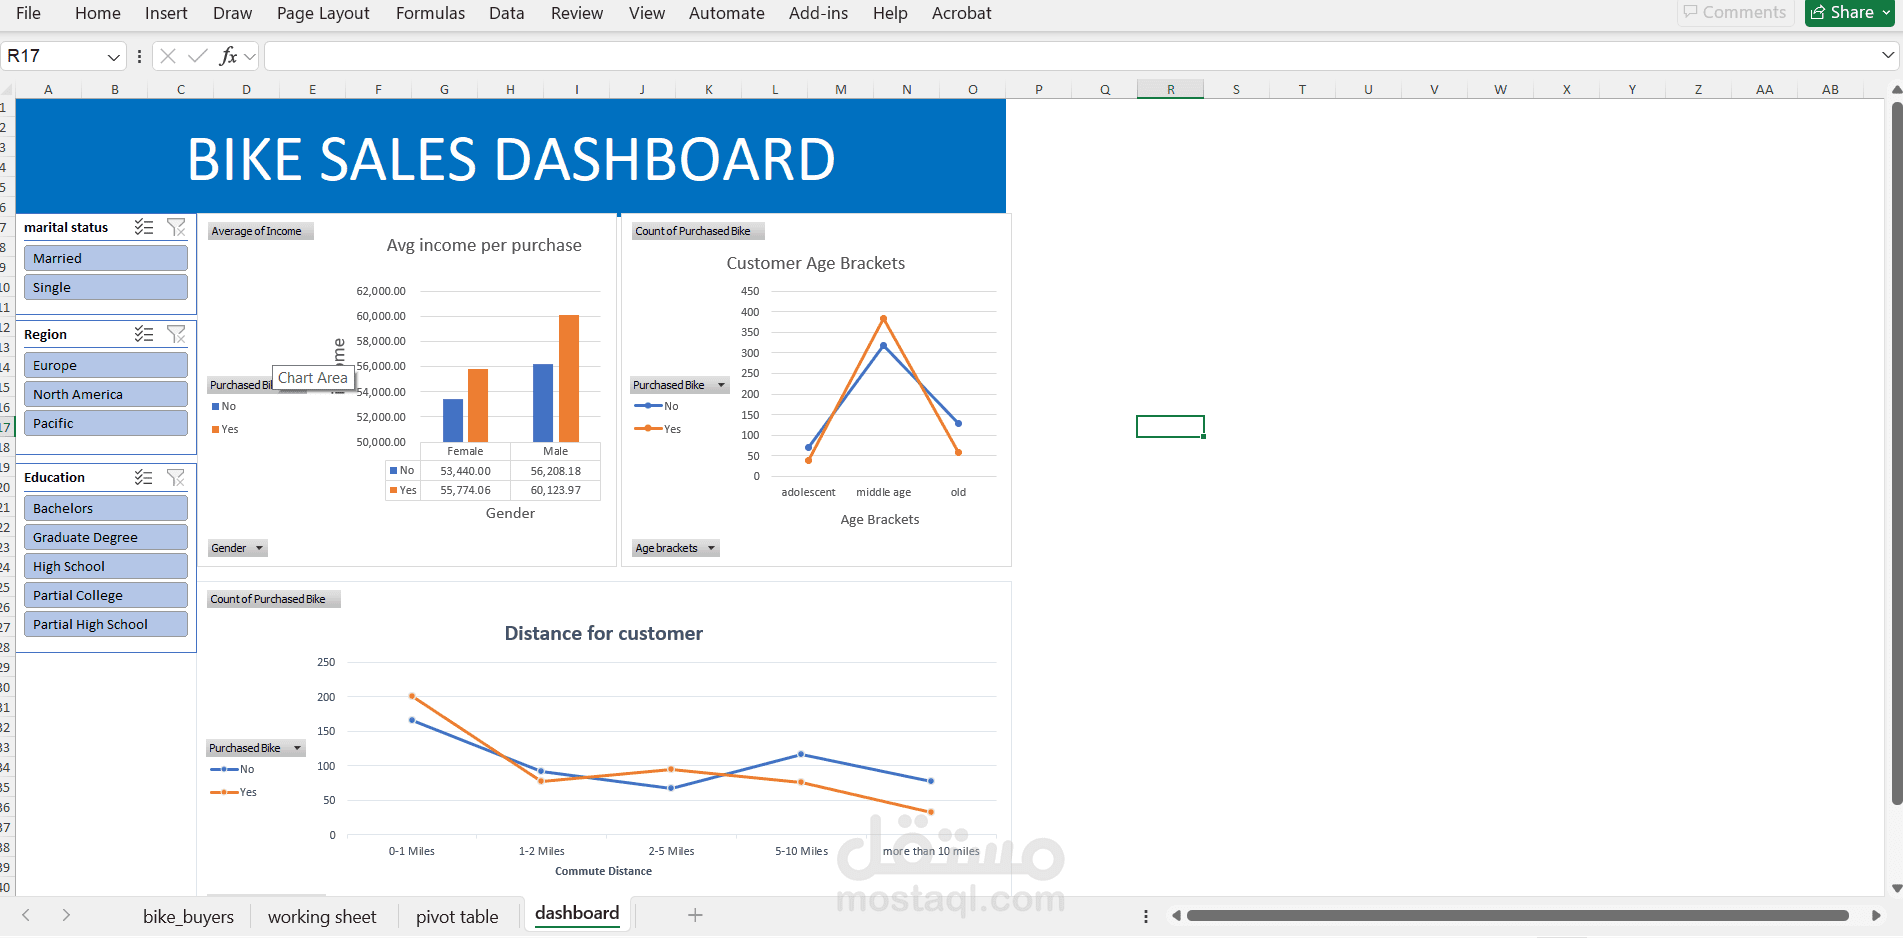
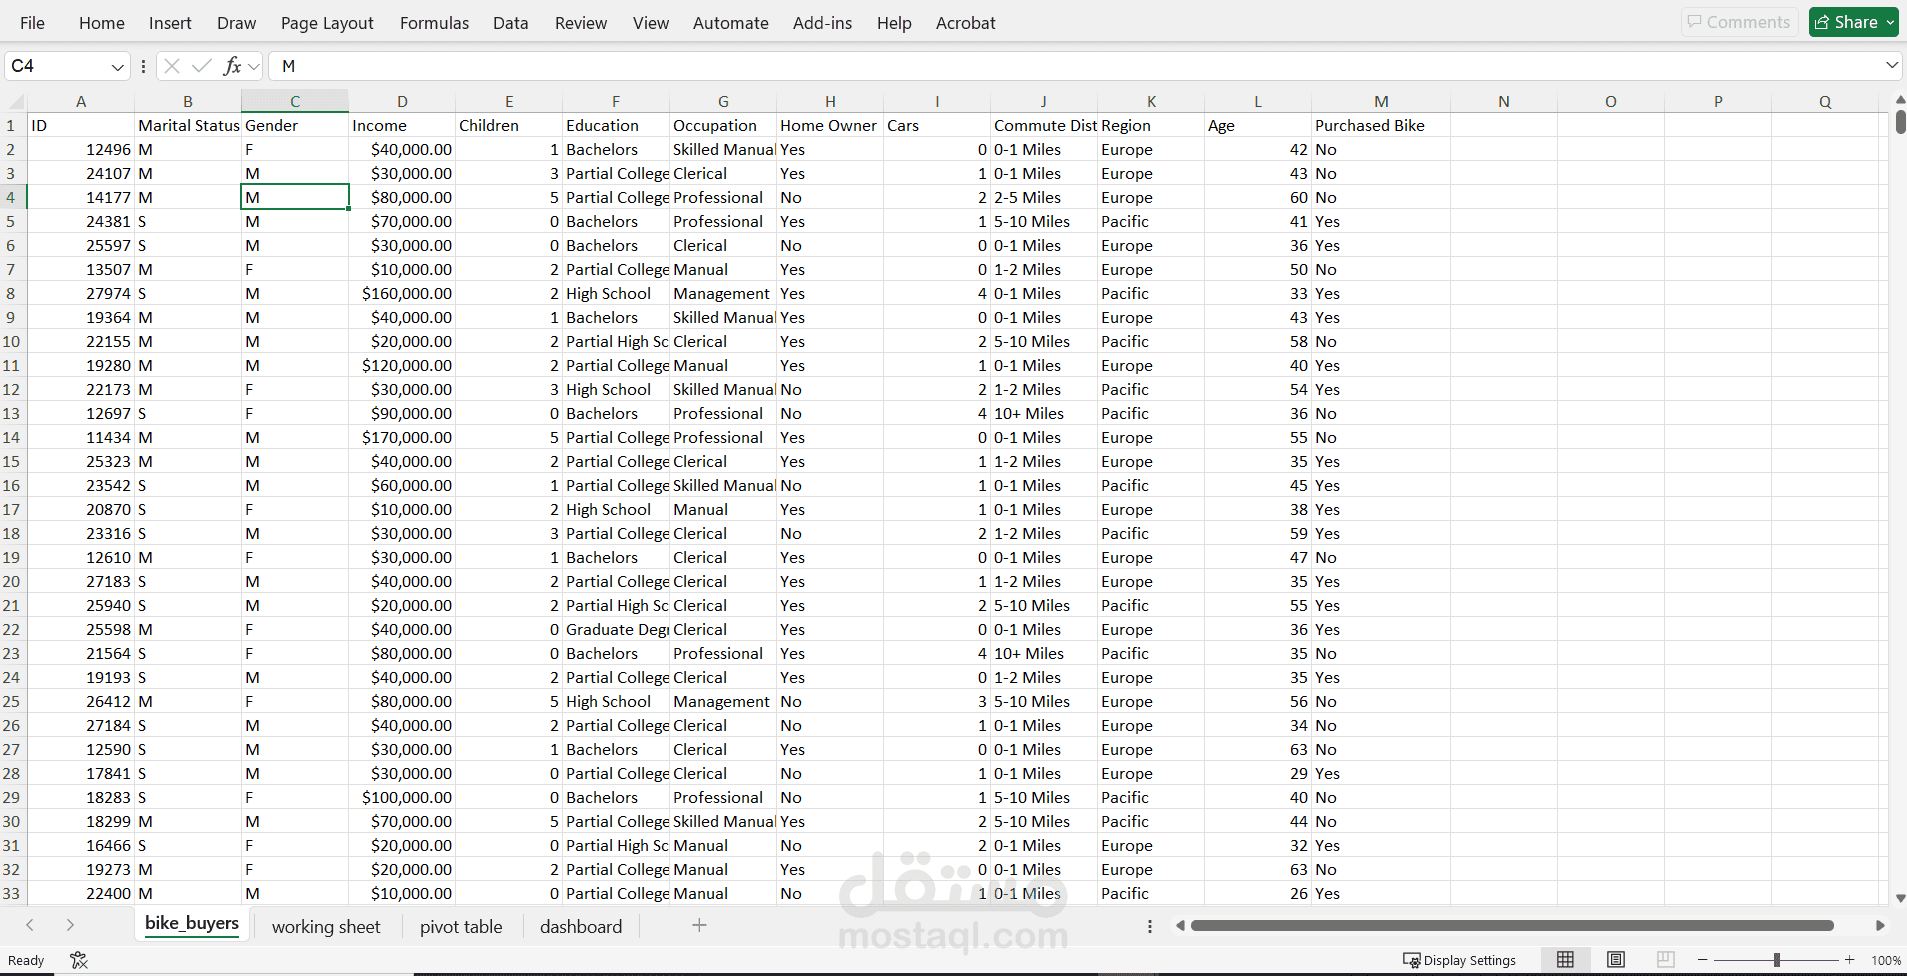

Built a simple Excel dashboard focused on Bikes sales analysis.
Tracked sales performance by region, time, and salesperson.
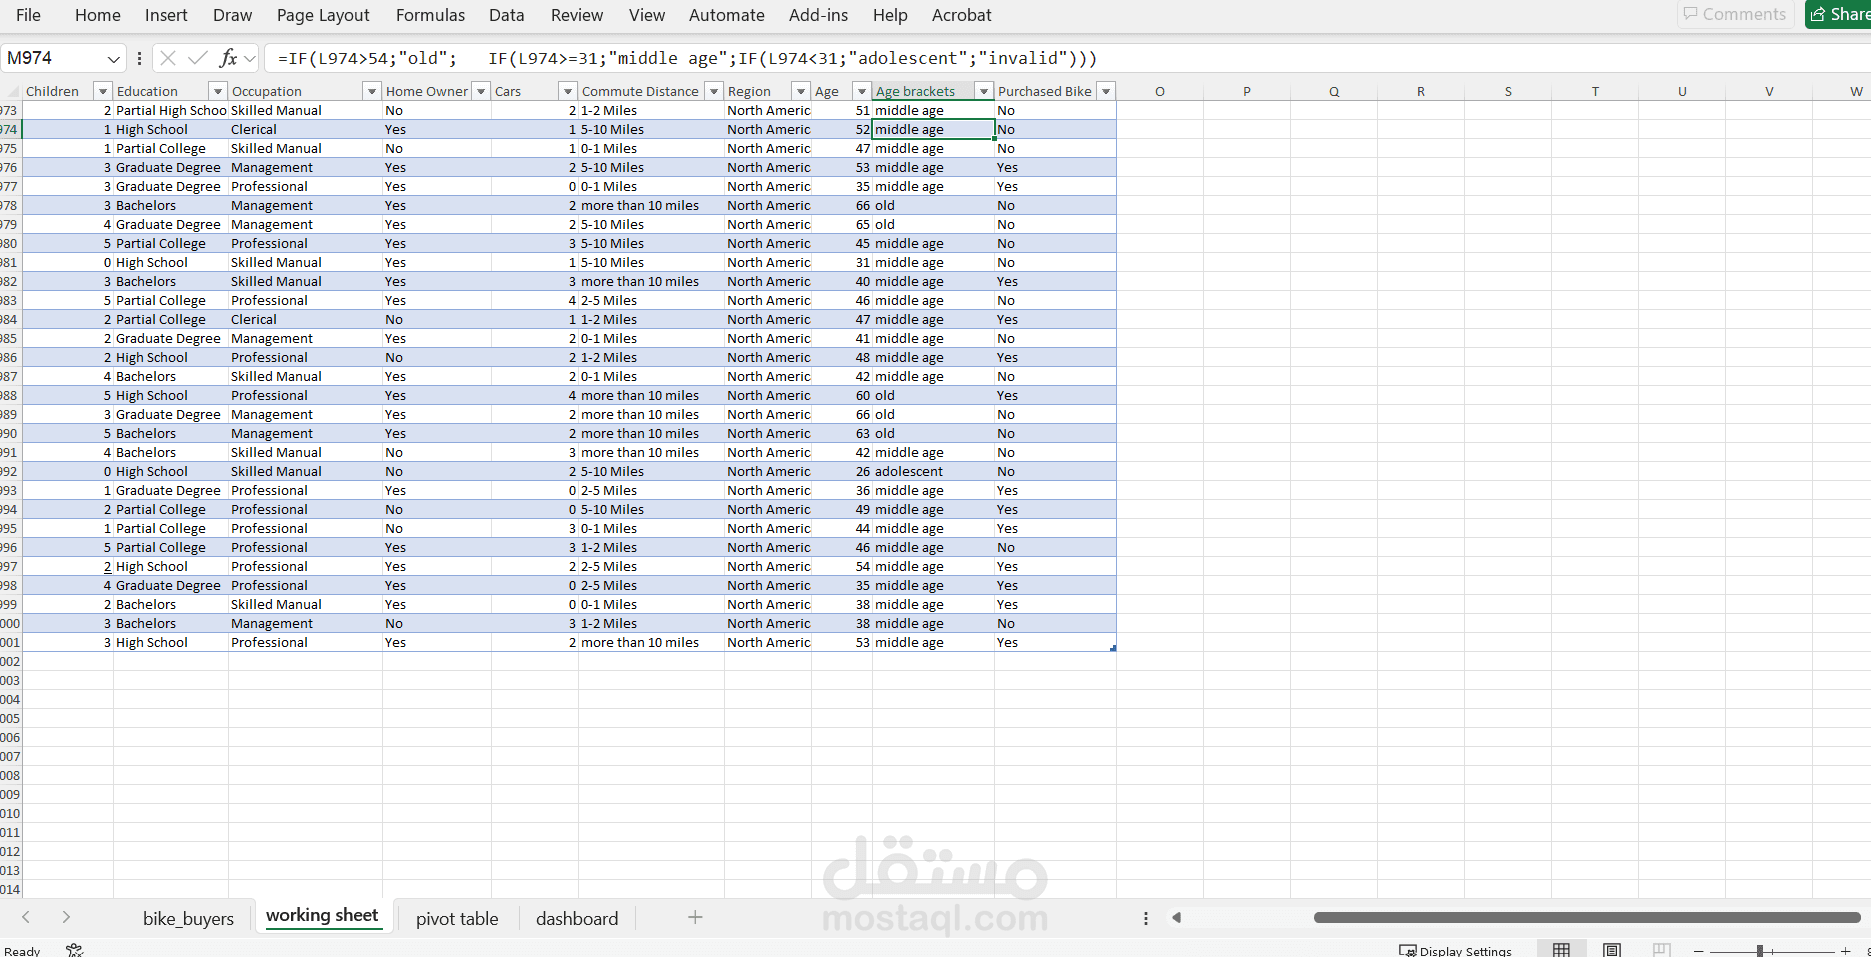
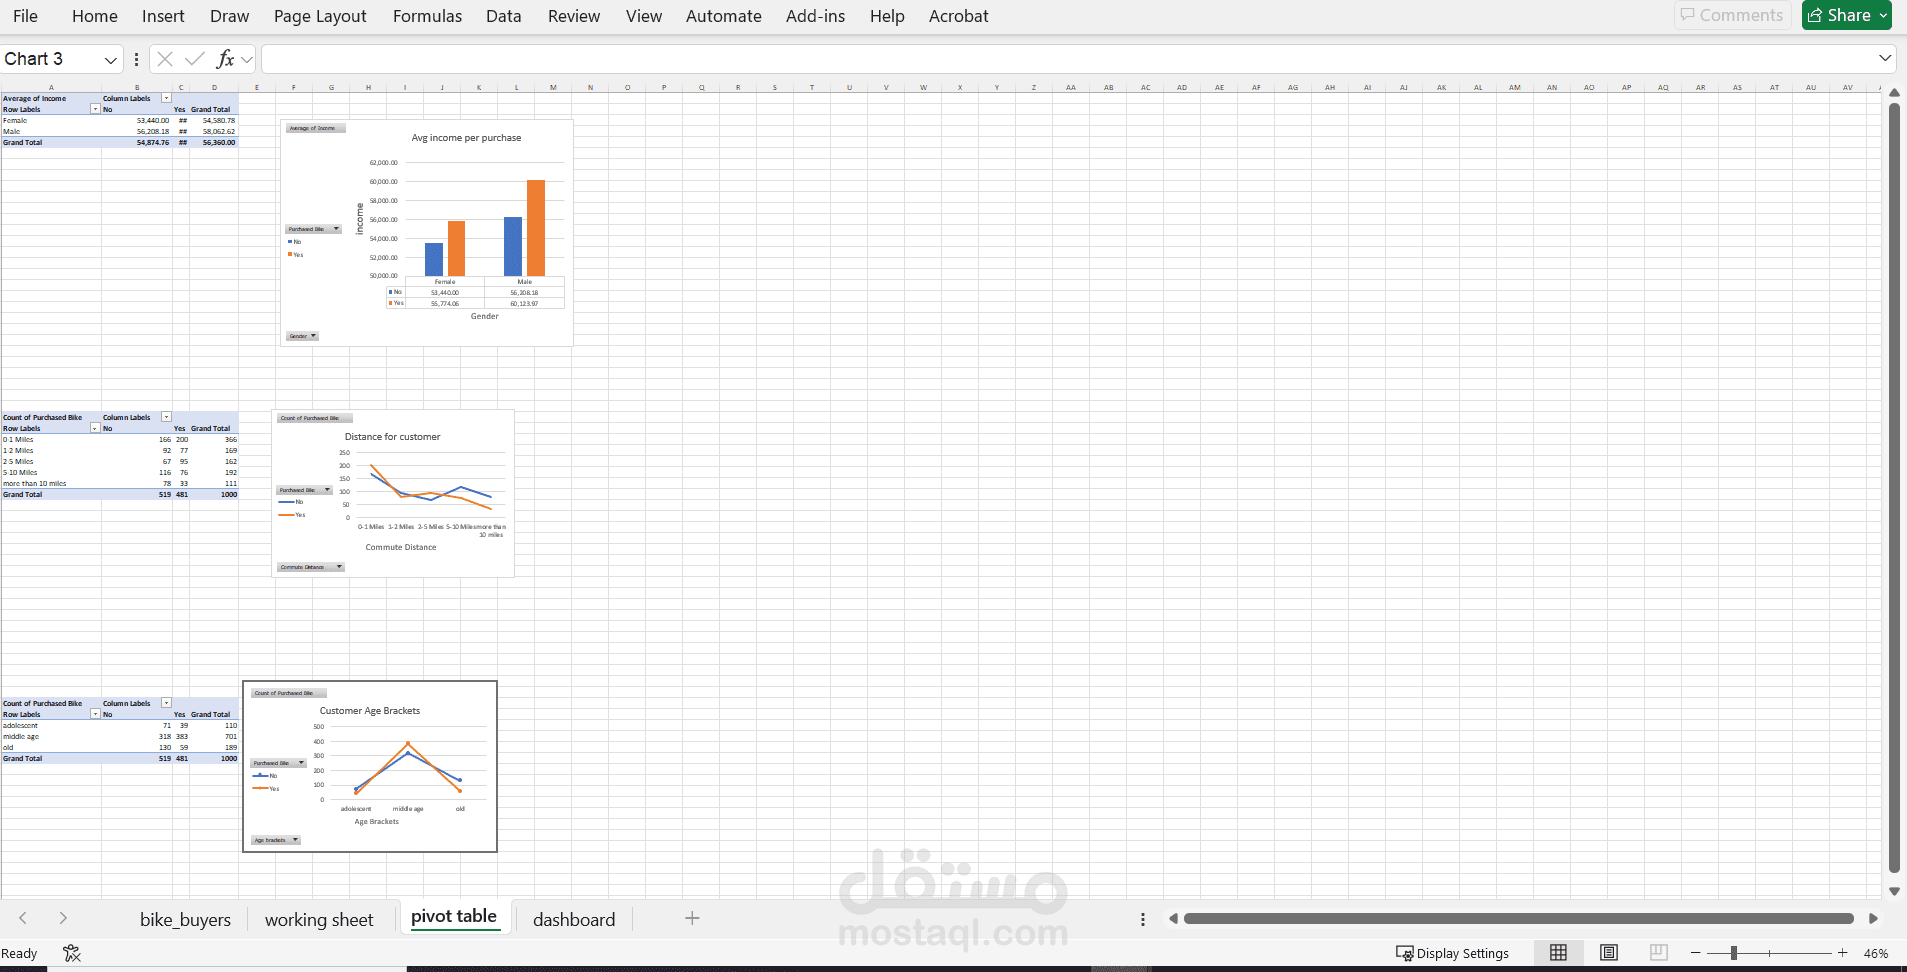
Used PivotTables and Power Query to clean and transform data.
Visualized KPIs such as total sales, shipping cost, and delivery time.
Helped highlight patterns and trends in the bikes category to support data-driven decisions.