Employee sales performance dashboard
تفاصيل العمل
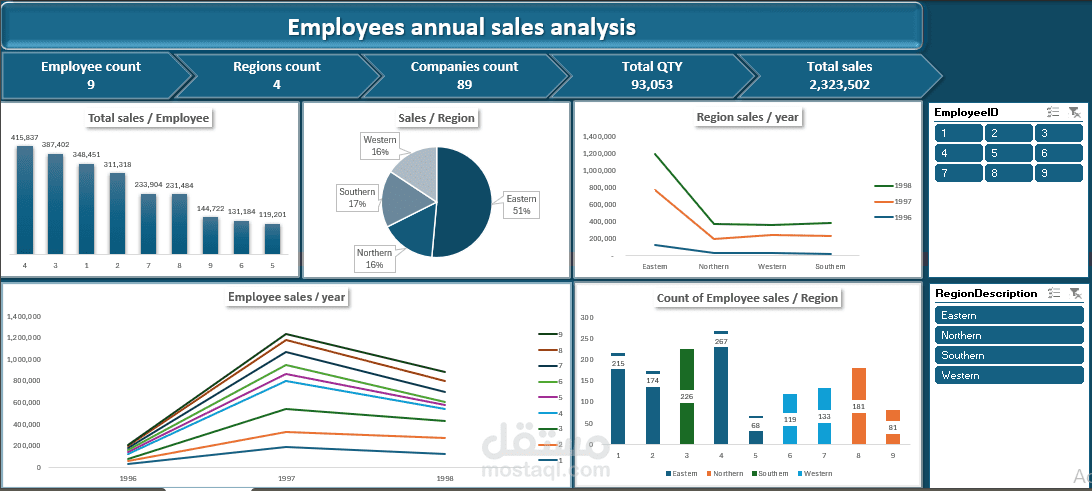
Developed a comprehensive and interactive dashboard to analyze annual employee sales performance. The process began with collecting and consolidating data from 7 separate Excel sheets, followed by data cleaning and transformation to ensure accuracy and consistency. Leveraged advanced Excel functions and Power Query to merge datasets, then created customized Pivot Tables for deep-diving into individual and team performance metrics.
Utilized dynamic visuals and slicers to design an intuitive interactive dashboard, enabling stakeholders to:
Monitor key performance indicators (KPIs)
Compare individual performance across regions
Identify top performers and areas for improvement
Analyze trends across months and regions
This solution significantly improved reporting efficiency and enhanced data-driven decision-making for sales leadership.