Candy sales data analysis
تفاصيل العمل
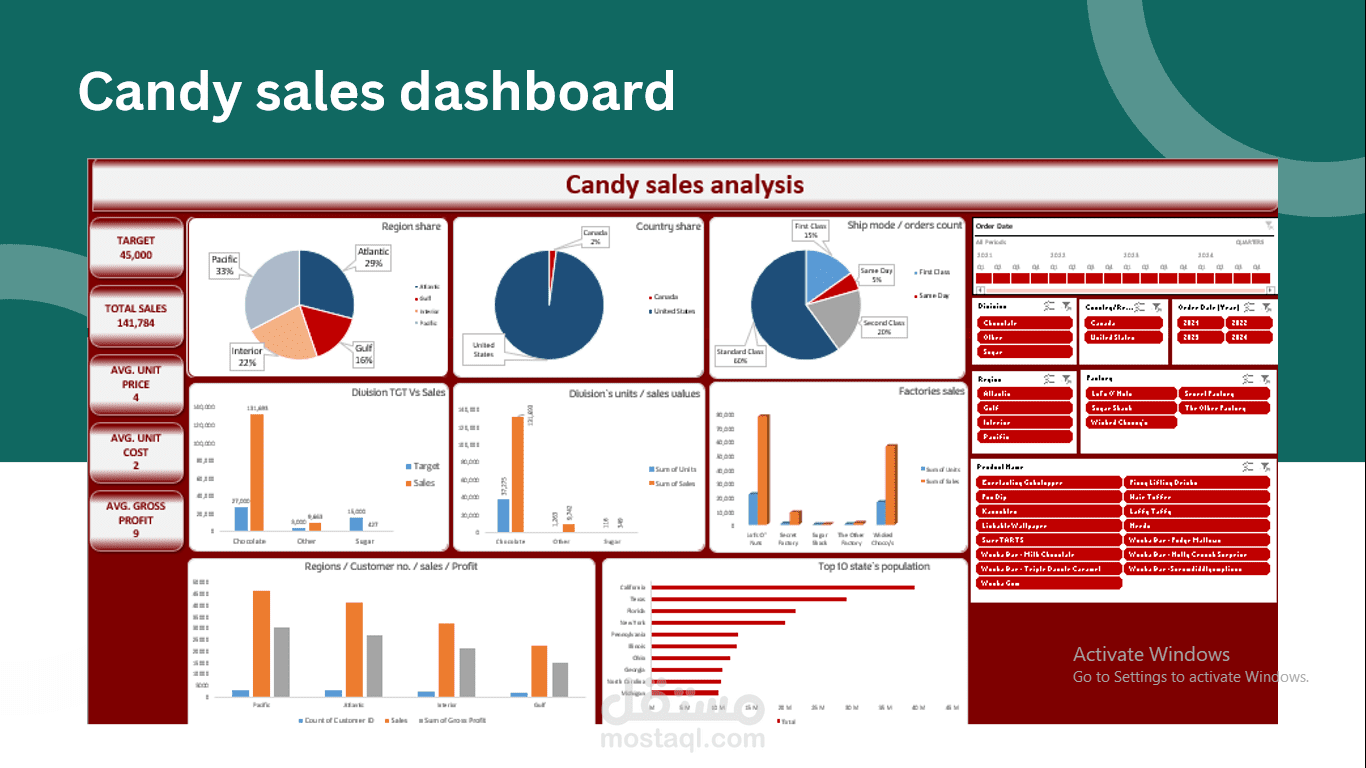
This dashboard series provides a comprehensive analysis of annual candy sales performance across regions, products, divisions, and customer segments. The process began with collecting data from multiple sources, followed by data cleaning, integration, and transformation to ensure accuracy and consistency. The datasets were merged and analyzed using custom PivotTables and advanced Excel visualizations to generate actionable insights.
Key Insights
- Total Sales: 141,784 units against a target of 45,000, exceeding the goal by over 215%.
- Chocolate products are best seller
- Pacific region leads in customer count, sales, and gross profit
- Standard Class shipping is the most used (60%)
-“Lot’s O’ Nuts” and “Wicked Choccy’s” factories generate the highest revenue
Top-selling products include:
Wonka Bar – Triple Dazzle Caramel
Wonka Bar – Nutty Crunch Surprise
Wonka Bar – Fudge Mallows
Certain niche products (e.g., “Everlasting Gobstopper”) have low sales volume, indicating potential for targeted marketing.
-High-gross-profit products are clustered in premium chocolate items, with lower-margin items in novelty and sugar-based products.
- Continuous growth across most top products, with clear upward sales trajectories over the four-year period.
Business Impact
The dashboards enable stakeholders to:
Monitor KPI performance vs targets in real time.
Identify top-performing products and regions to focus marketing and distribution efforts.
Detect low-performing products for possible discontinuation or promotion.
Understand the relationship between shipping mode and sales volumes.
Support strategic decision-making for production, pricing, and market expansion.