project ml
تفاصيل العمل

Dataset Description
This dataset contains information about Facebook posts and their engagement metrics.
It consists of 7,050 rows (posts) and 16 columns. Each row represents a single Facebook post, and the columns provide details about its type, publishing time, and how people interacted with it.
the Dataset Represents
It tracks engagement on Facebook posts.
You can use it to analyze
Which type of posts (photo, video) gets the most attention
What time of posting works bes
How people react differently (more Likes vs. Loves vs. Angry
The overall popularity of content based on comments, shares, and reactions
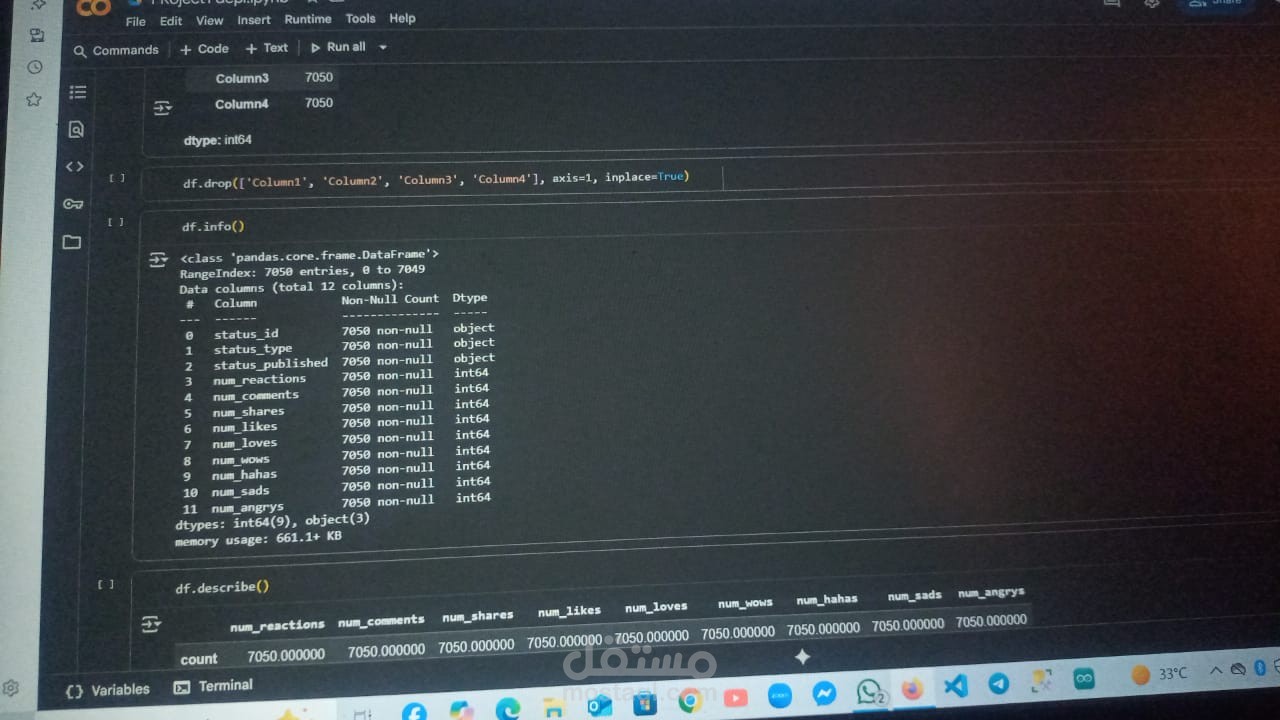
Data Loading & Cleaning
- Loaded dataset with 7050 rows and 16 columns
- Dropped empty columns (Column1–Column4
- Dropped ID/time columns (status_id, status_published
- Final dataset has 10 columns (9 numeric + 1 categorical)
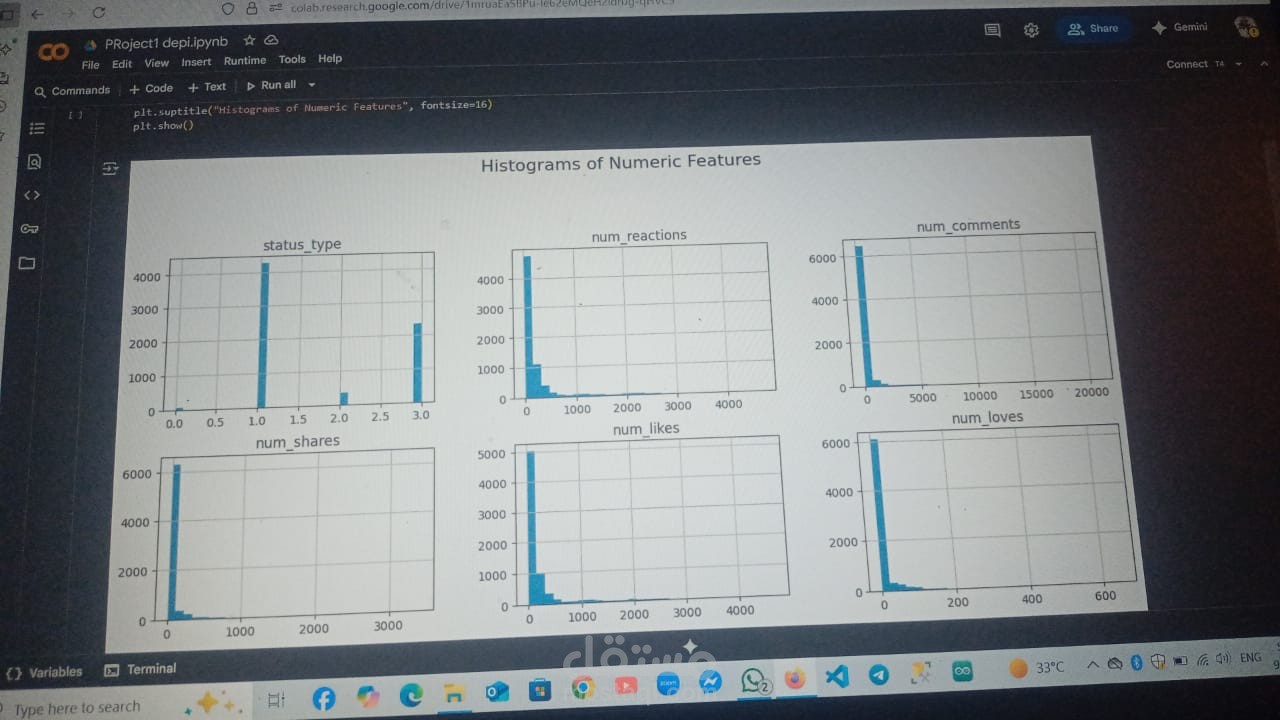
(Exploratory Data Analysis (EDA)
- Plotted correlation heatmap for numeric features
- Histograms were generated to see distribution of numeric values.
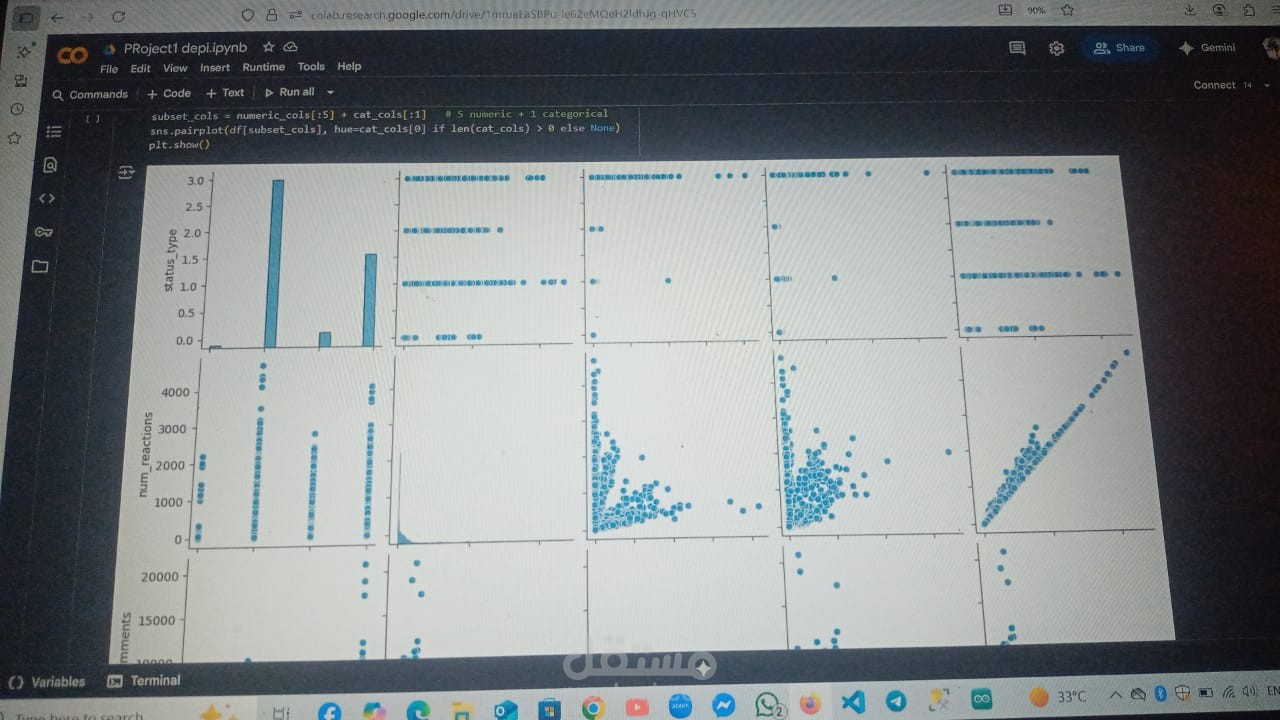
- Pairplot was created for subset of features to visualize relations between variables
Preprocessing
- Encoded categorical column 'status_type' using LabelEncoder.
- Scaled features using MinMaxScaler and StandardScaler for normalization.
Converted scaled arrays back into DataFrame
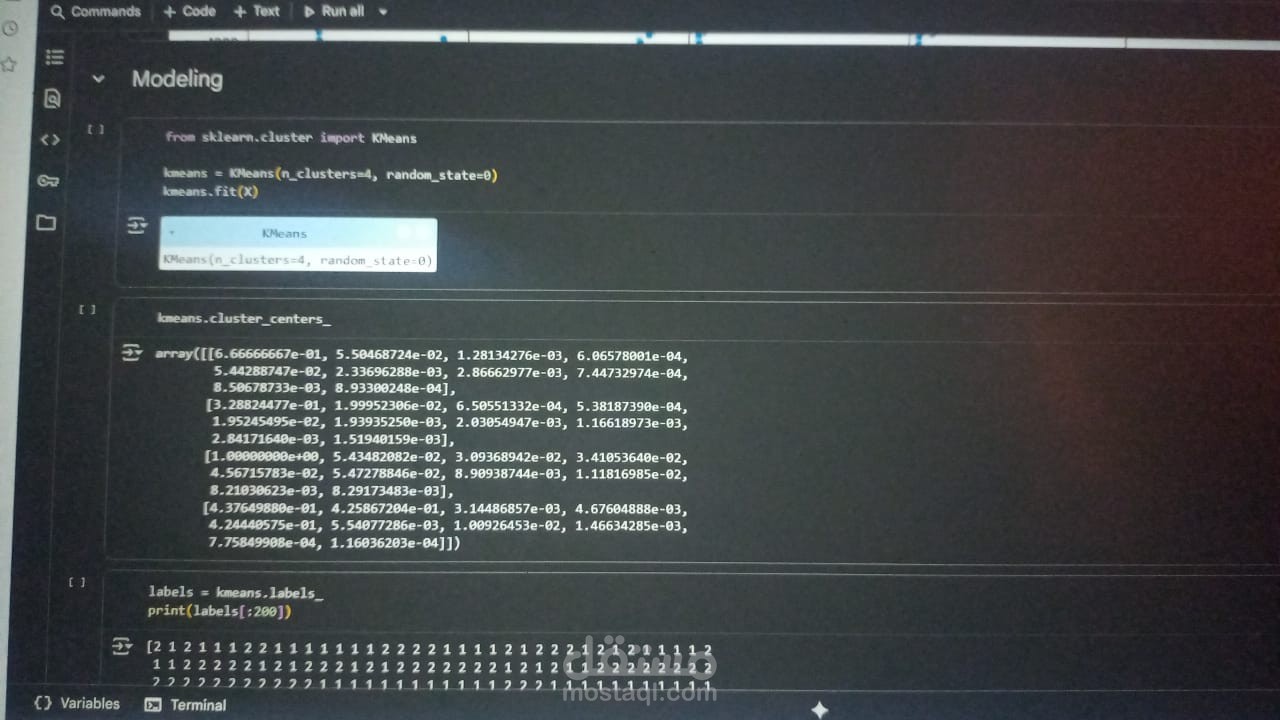
Clustering (KMeans
- Applied KMeans clustering with different cluster sizes.
- Evaluated performance using Silhouette Score.
- Best performance: n_clusters=6, Silhouette Score=0.77.
Also tested Elbow Method to visualize optimal cluster number.
Dimensionality Reduction (PCA)
- Applied PCA to numeric features after scaling.
- Explained variance plot showed 95% variance captured by 8 components.
- Visualized first 2 PCA components in scatter plot.
Classification Models
- Decision Tree (max_depth=5): Accuracy = 0.77.
- Logistic Regression: Train Accuracy = 0.75, Test Accuracy = 0.75.
- KNN (best K=5): Accuracy = 0.78.
- Observations: Small classes (status_type=0,2) were difficult to classify → low precision/recall.
Regression Models
- Target variable: num_reactions.
- Linear Regression: R² = 0.9999, RMSE ≈ 0.01 (almost perfect fit).
- Random Forest: R² = 0.9994, RMSE ≈ 121.83.
- XGBoost: R² = 0.9898, RMSE ≈ 2199.63.
- Observation: Linear Regression performed the best due to strong linear correlation between features.