machine learning projects
تفاصيل العمل
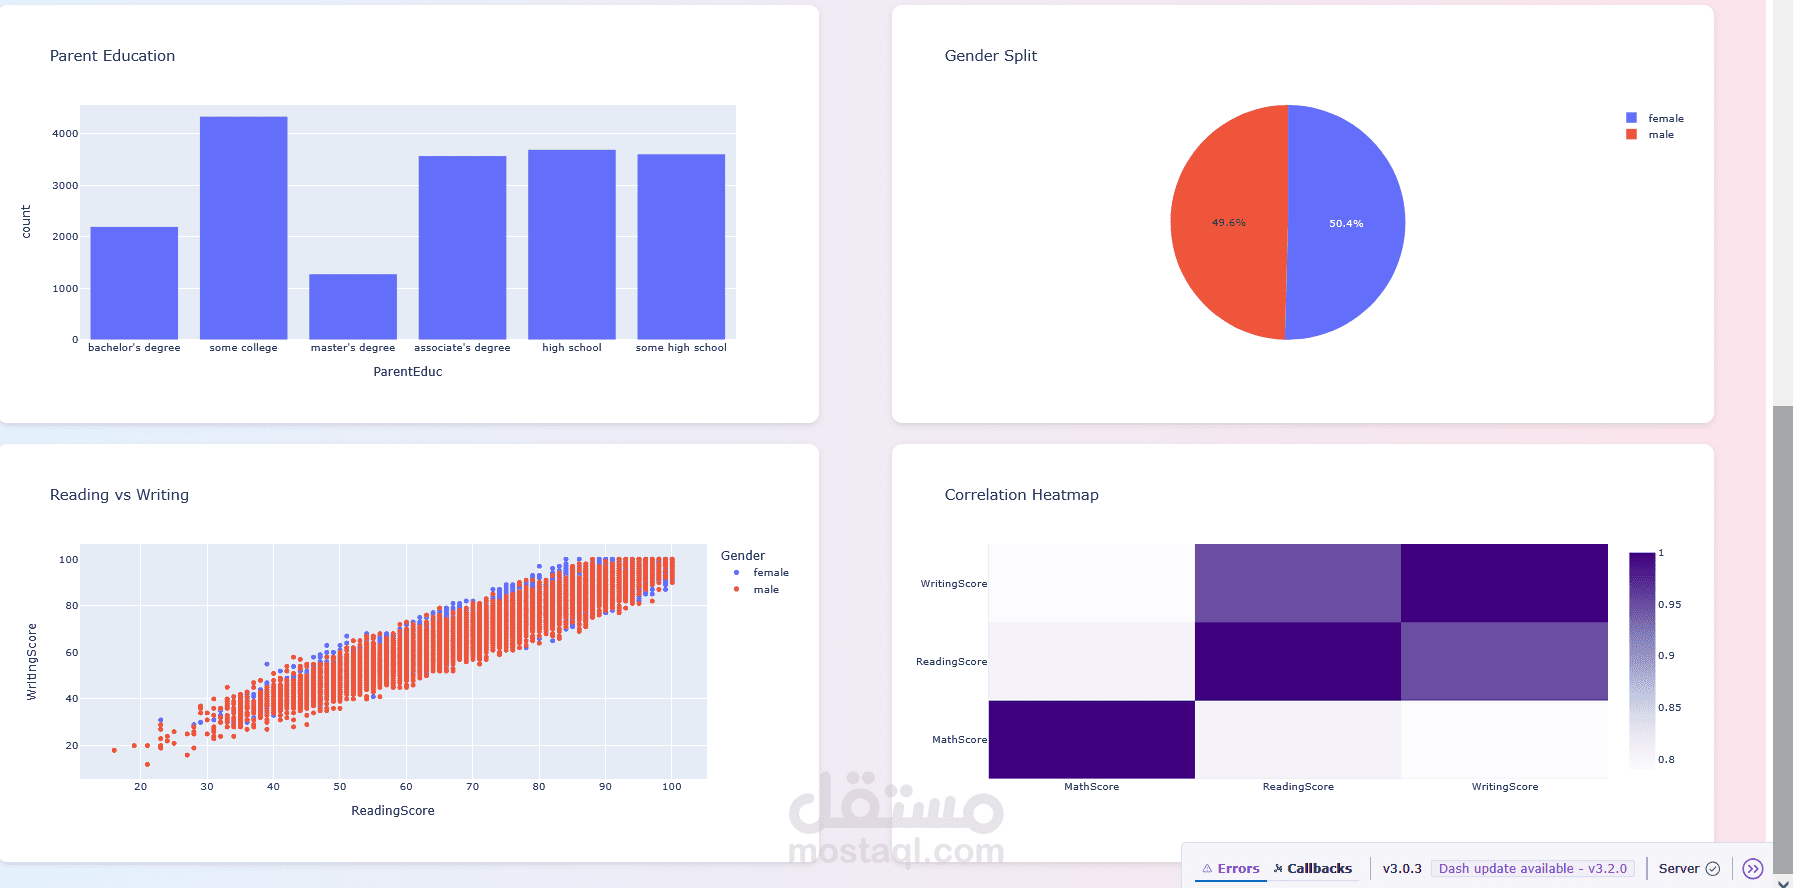
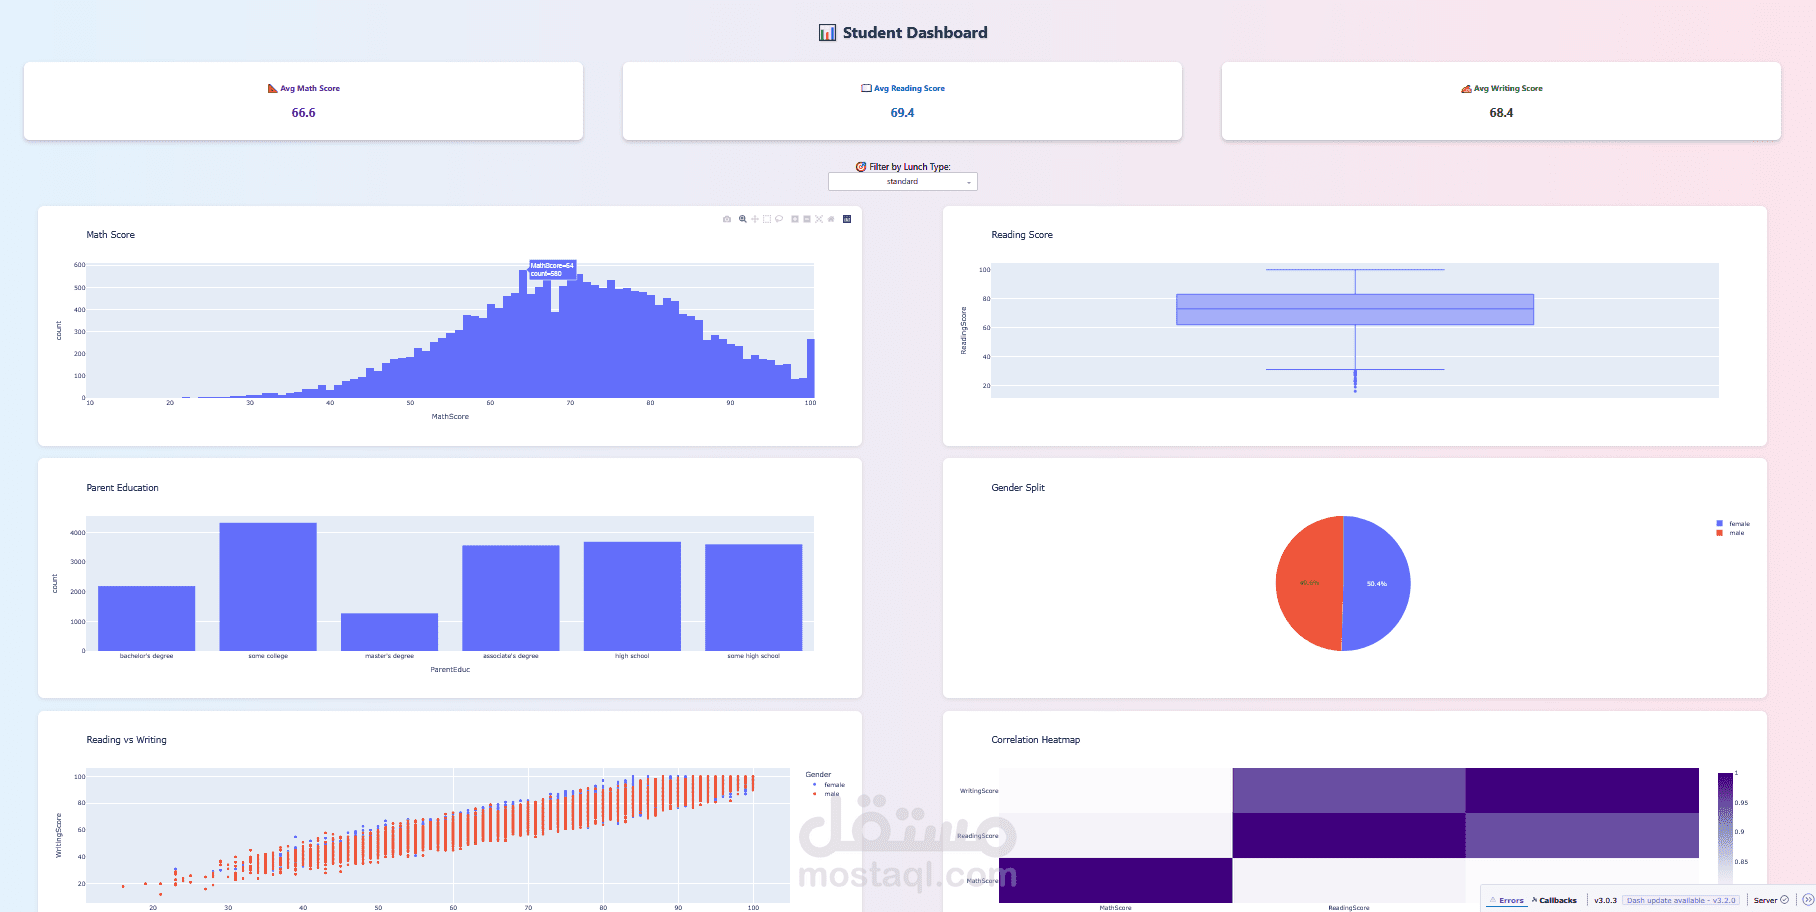
interactive Data Visualization Dashboard
Developed an interactive dashboard using Python, Dash, and Plotly to explore and analyze a dataset with multiple features. The project involved data preprocessing and cleaning with Pandas and NumPy, exploratory data analysis with Seaborn and Matplotlib, and scaling techniques using Scikit-learn. The dashboard provides dynamic visualizations and interactive controls, enabling users to filter, analyze, and gain insights from the data efficiently