Call Center Dashboard (Power BI)
تفاصيل العمل
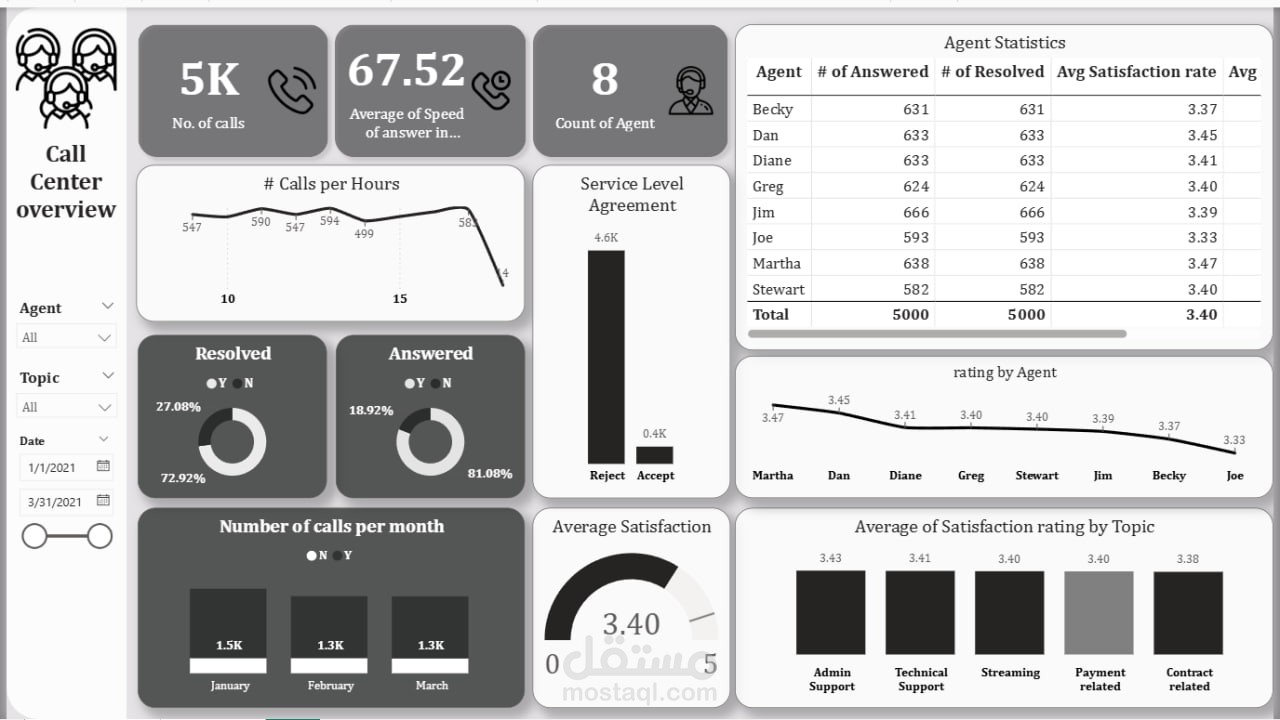
This interactive Power BI dashboard provides a comprehensive view of call center performance and efficiency. It delivers real-time insights into:
Key Metrics: Total calls (5K), average speed of answer, and number of active agents.
Call Trends: Distribution of calls by hour and by month to analyze workload patterns.
Service Quality: Answered vs. resolved calls, with SLA compliance (accepted vs. rejected cases).
Agent Performance: Detailed breakdown of calls handled, resolved, and average satisfaction scores per agent.
Customer Satisfaction: Overall satisfaction score (3.40) and comparison of ratings across topics like admin support, technical support, streaming, payment, and contract-related issues.
Designed to help managers monitor KPIs, identify trends, optimize agent productivity, and improve customer experience through data-driven decision making.