Power bi
تفاصيل العمل
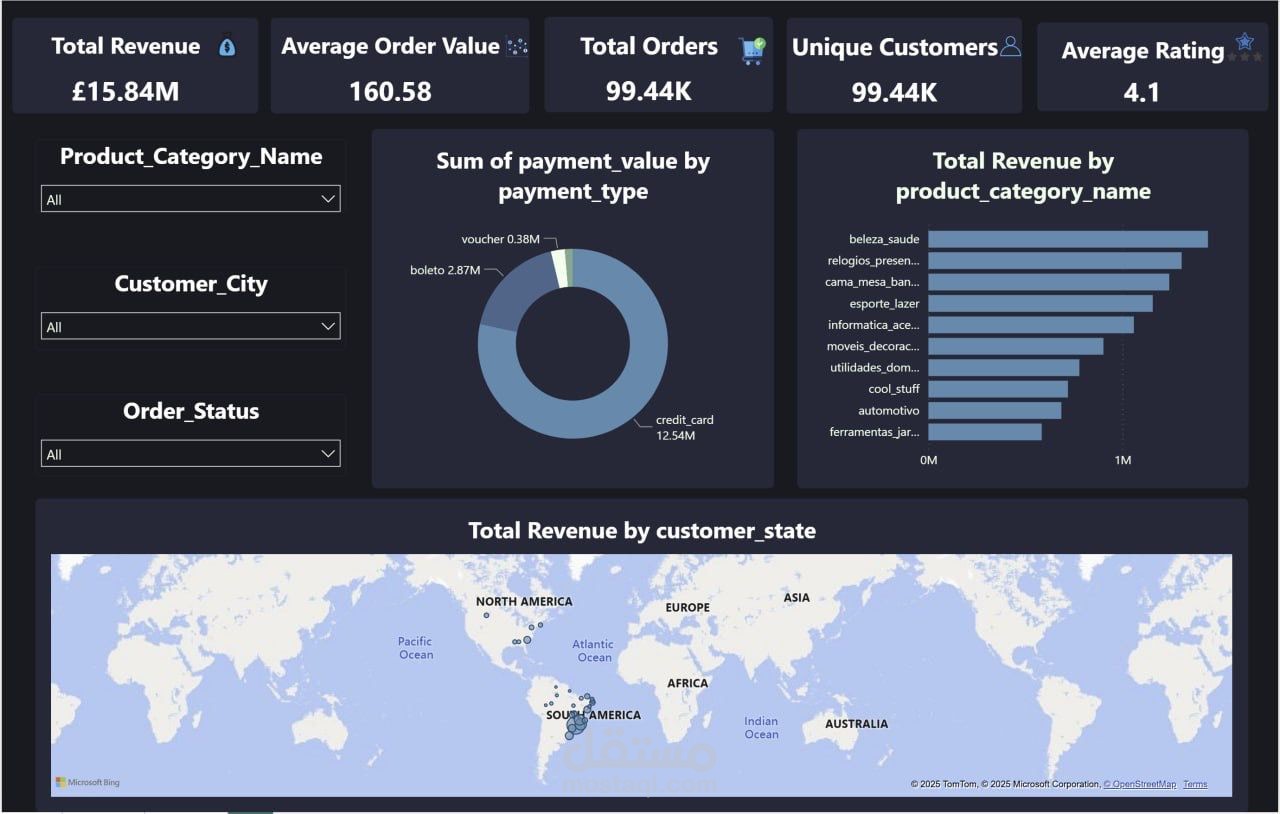
I developed an interactive dashboard using Power BI to analyze business data.
The project started with uploading Excel files, cleaning the data, and creating relationships between tables.
I built different visualizations, including:
Total Revenue and Total Orders
Sales Trend over time
Top Categories and Products
Revenue by State/Region
Payment Methods Distribution
Customer Review Ratings
This dashboard provided a clear view of the company’s performance, making it easier to identify trends, track sales, and understand customer behavior. The design was focused on clarity, simplicity, and supporting business decisions.