Tableau
تفاصيل العمل
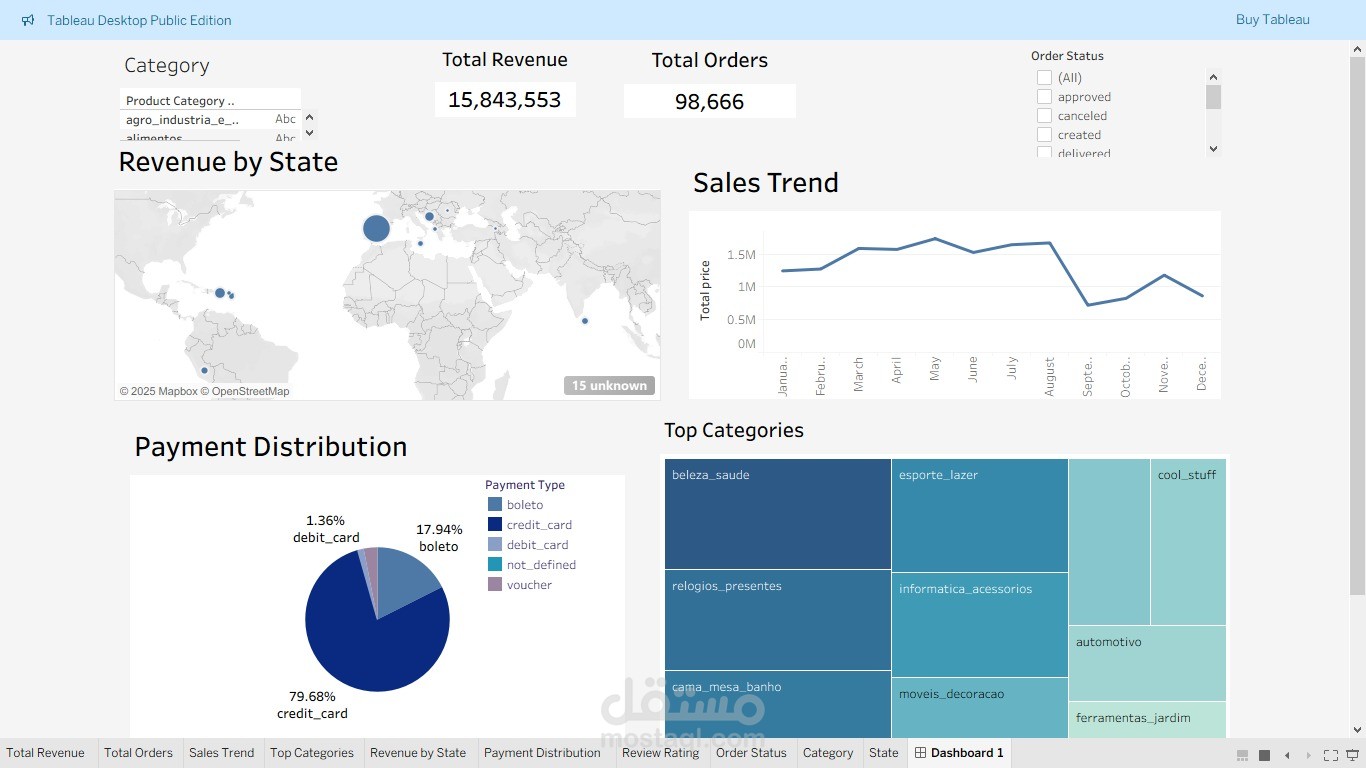
I worked on creating an interactive dashboard using Tableau to analyze business data.
The process started with uploading Excel files and building relationships between the tables.
Then I designed several visualizations, including:
Total Revenue
Total Orders
Sales Trend over time
Top Categories
Revenue by State
Payment Distribution
Customer Review Ratings
The dashboard helps to understand sales performance, identify best-selling categories, and track customer satisfaction.
It was designed to be clear, organized, and easy to use for decision-making