Data Analysis & Power BI Dashboard
تفاصيل العمل
Description
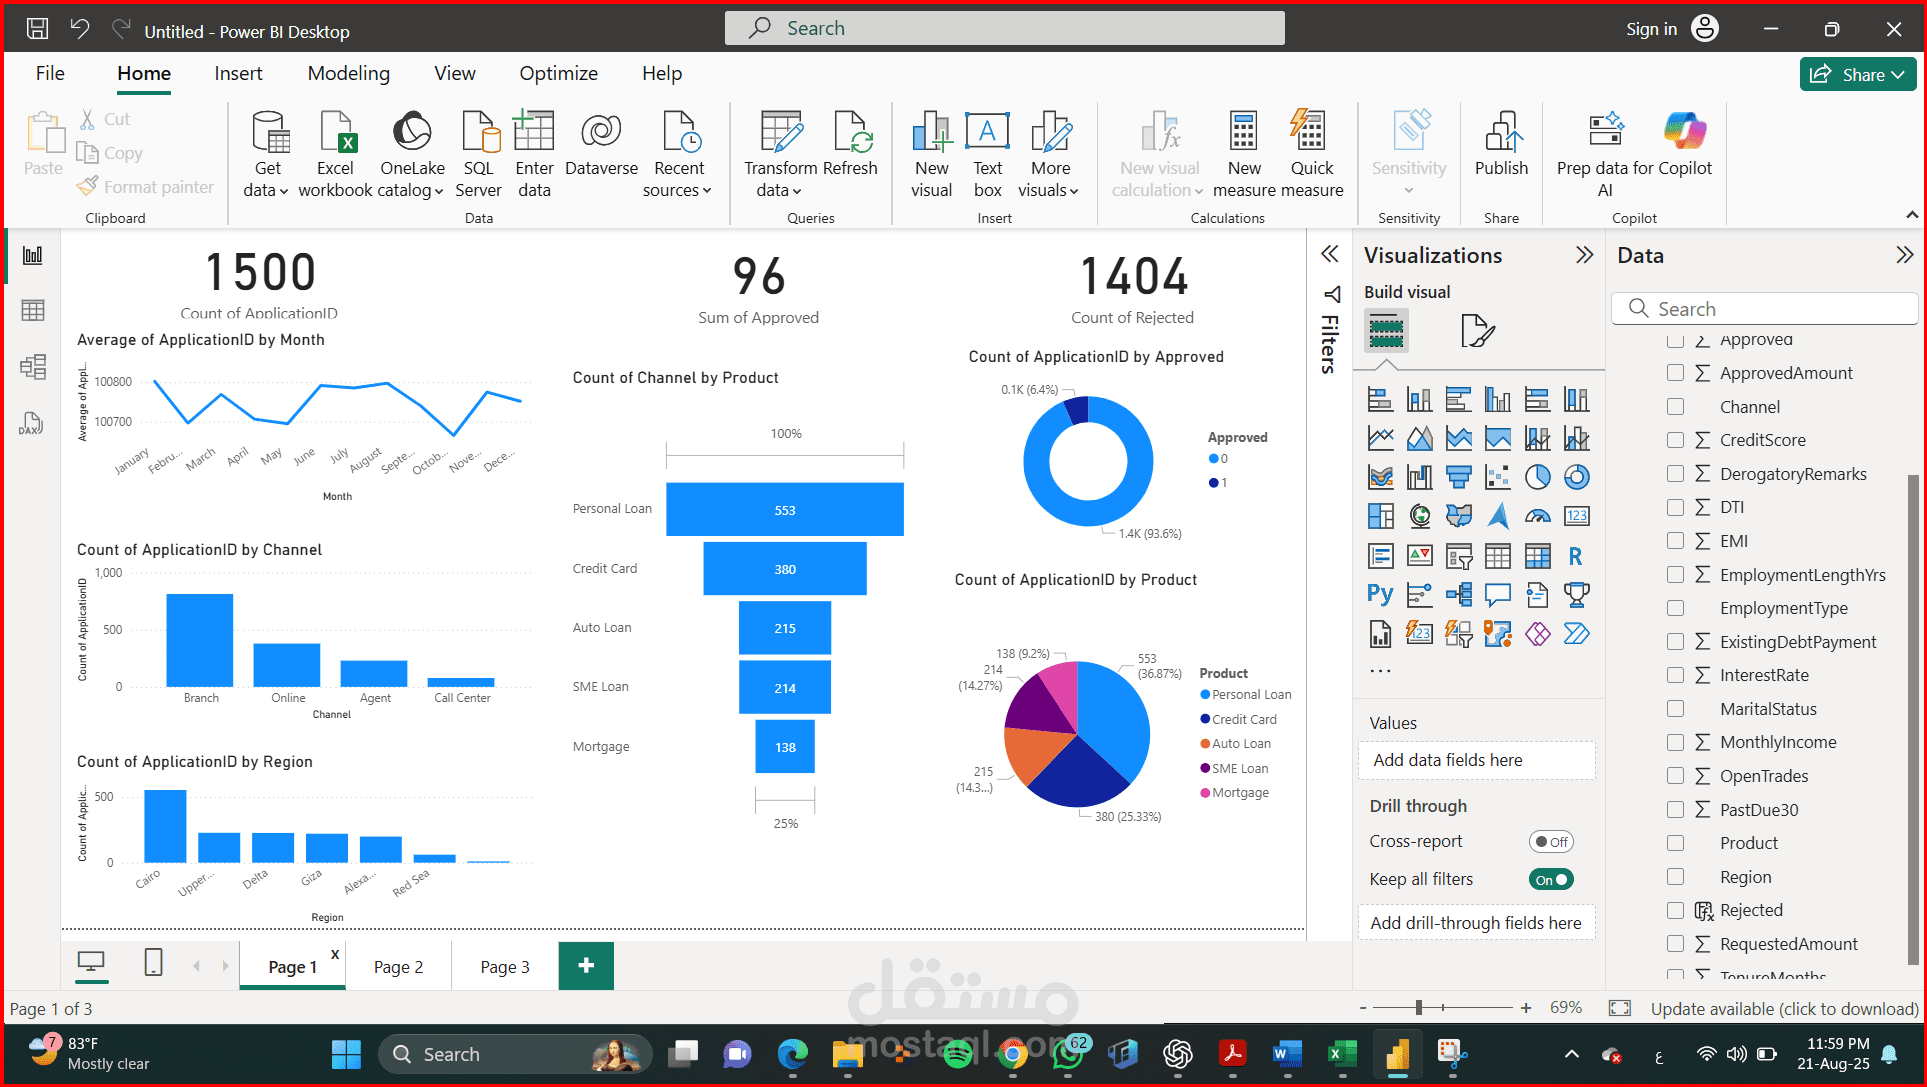
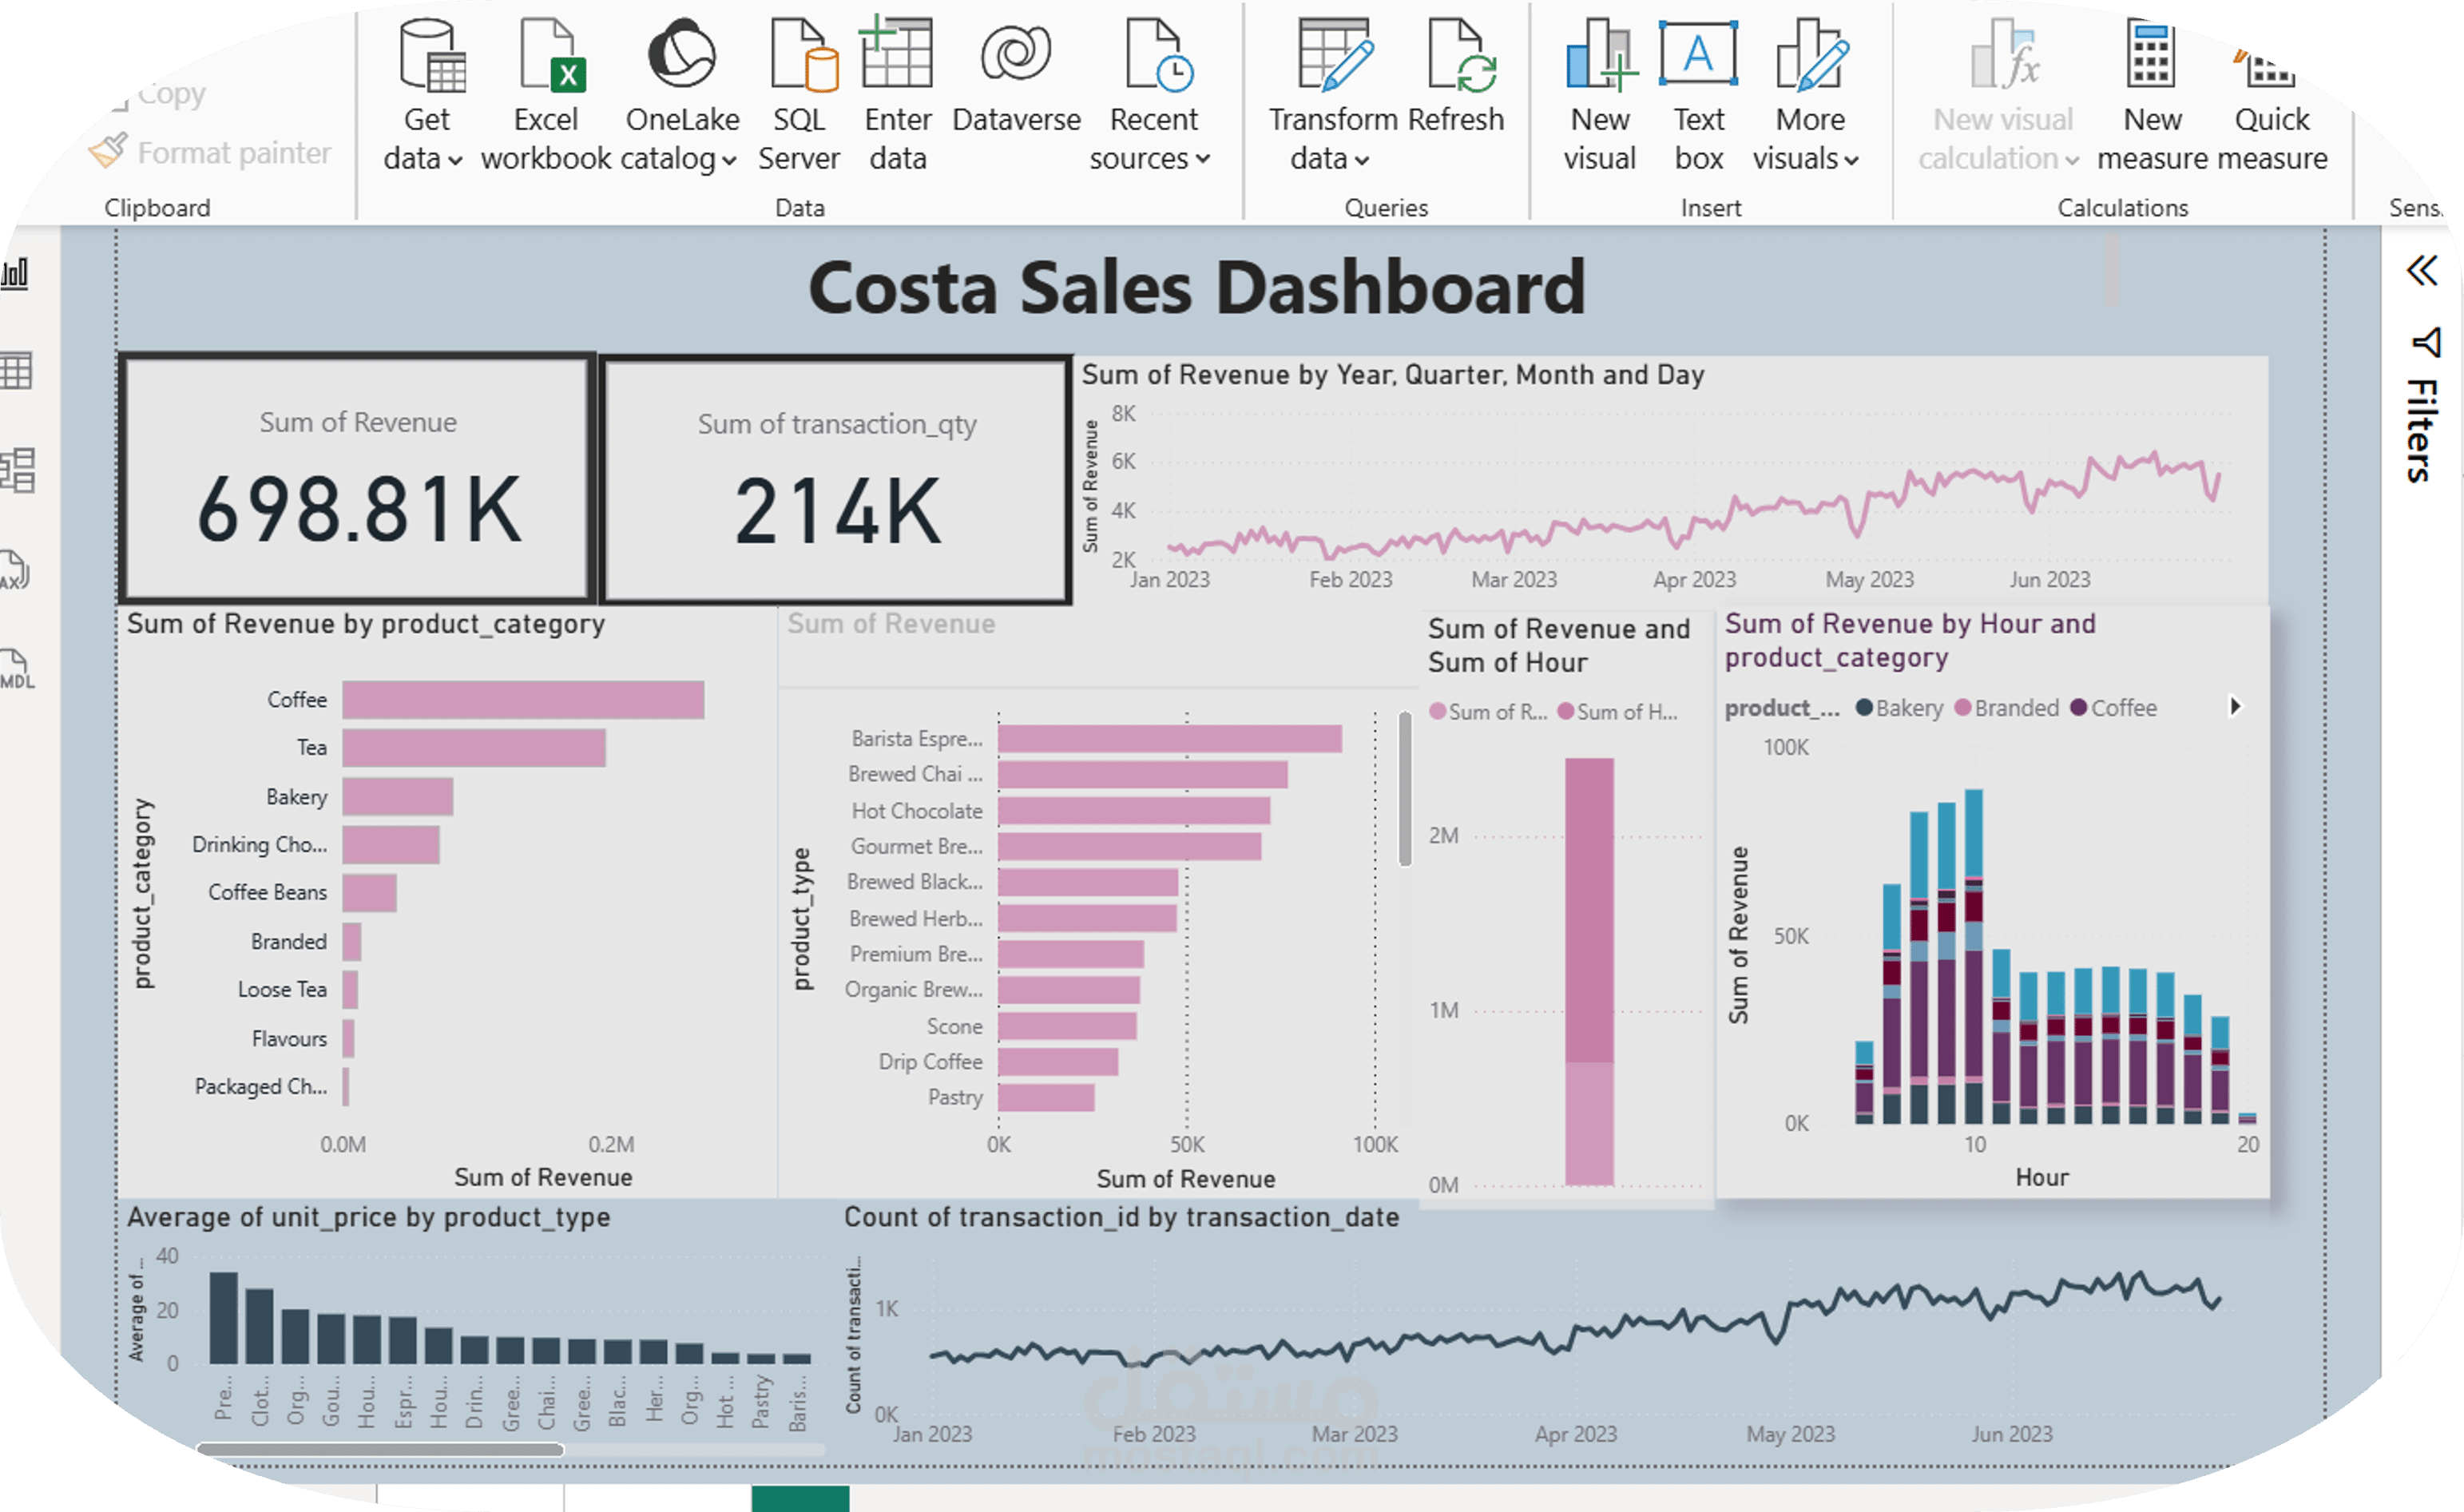
Performed data analysis on sales and inventory data, then developed an interactive dashboard in Power BI for easy understanding of performance trends. Dashboard included KPIs for revenue, cost, top-selling items, and slow-moving stock.
Outcomes:
Reduced reporting time from 2 days to 2 hours through automated dashboards.
Improved decision-making by visualizing key metrics in a simple and clear way.