Sales Analysis
تفاصيل العمل
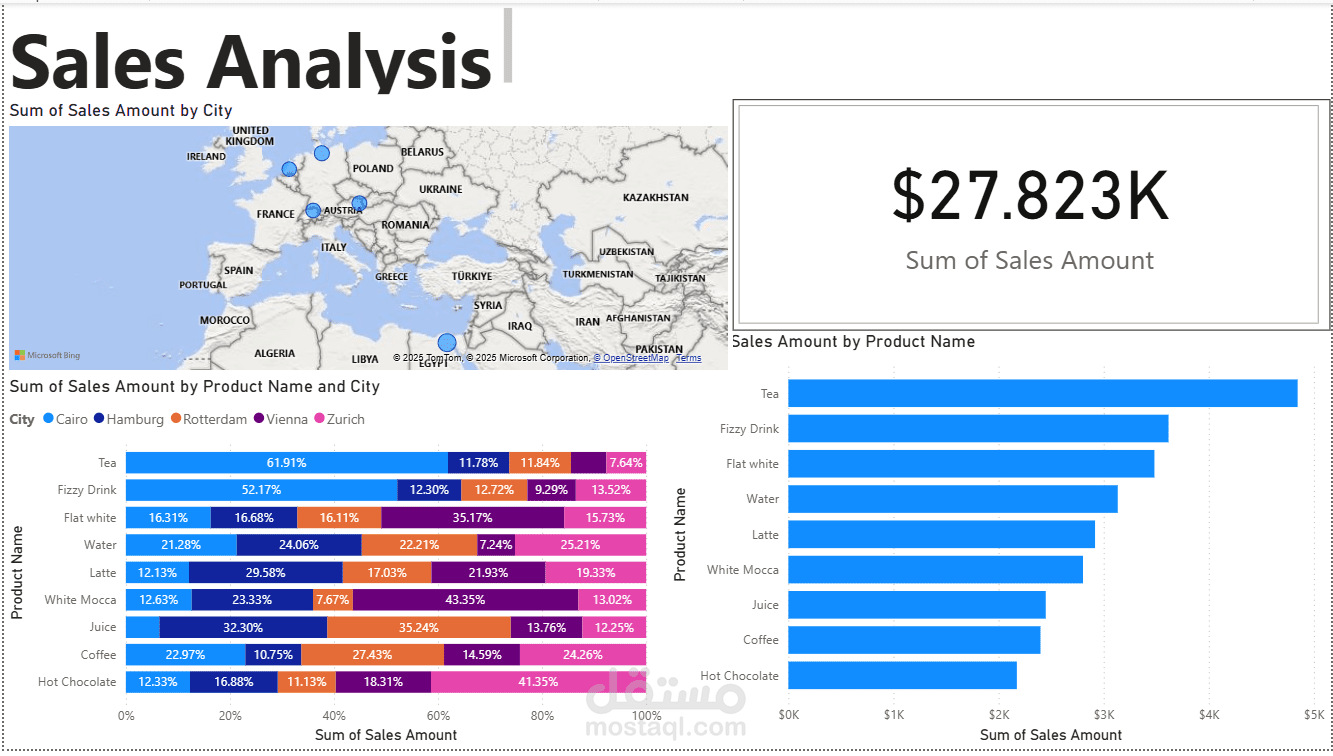
An interactive Sales Analysis Dashboard was created to visualize sales performance by city and product category. The dashboard presents total sales, regional distribution, and product-level insights, allowing sales trends and key markets to be identified clearly through data-driven visualization.