Sales Dashboard Development for Multi-Year, Multi-Region Data
تفاصيل العمل

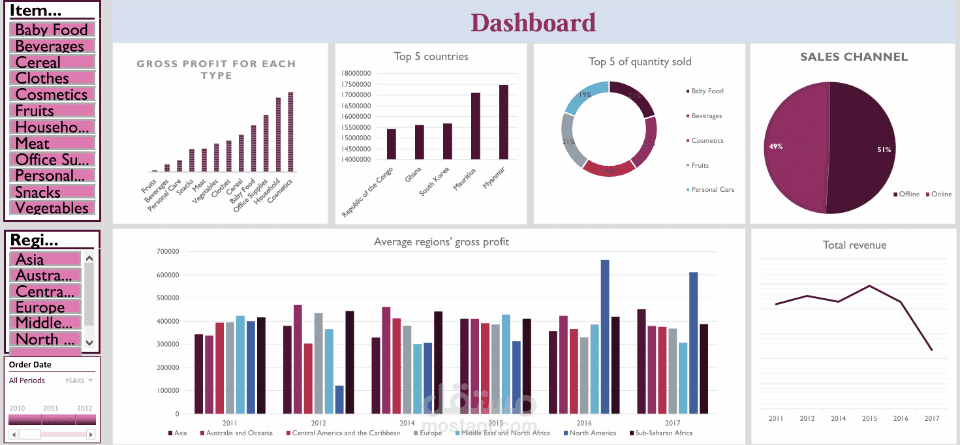
r several years and across multiple regions. The dashboard was built using [Excel / Power BI / Tableau] and provides:
Clear visualization of sales trends over time.
Comparison of performance between different regions.
Key metrics such as total sales, top-performing regions, and year-over-year growth.
Easy-to-use layout that allows managers to quickly understand results and make data-driven decisions.
This dashboard helps businesses monitor their sales effectively, identify growth opportunities, and improve strategic planning.