HR Dashboard
تفاصيل العمل
Overview:
I am looking for a skilled Front-End Developer or Dashboard Specialist to create a comprehensive, interactive, and visually appealing HR Analytics Dashboard. The dashboard will transform raw HR data into clear, actionable insights through modern data visualization. The design and data structure are provided in the reference images.
Key Objectives:
To provide management with an at-a-glance overview of key HR metrics.
To visualize employee data geographically, by department, and by gender.
To create an interactive user experience for exploring data trends.
To present complex data in an intuitive and easy-to-understand format.
Reference Materials:
I have provided two reference images (HR1.jpg and image.png) which contain the exact data sets, visual charts, and layout that the final dashboard should be based on.
Scope of Work & Key Features to Implement:
Overall Dashboard Layout:
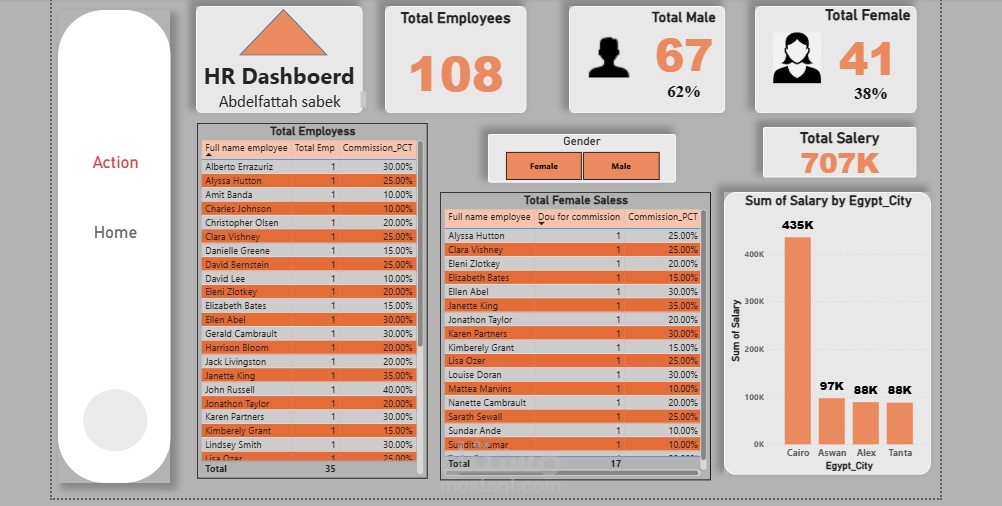
Recreate the clean and modern layout shown in the references, including the header "HR Dashboard - Abdelfattah Sabek".
Implement a navigation sidebar with menu items (e.g., "Home", "Actions").
Design should be responsive and visually cohesive.
Key Metric Cards (Top-Level KPIs):
Develop dynamic cards to display the following key figures:
Total Employees: 108
Total Male: 67 (62%)
Total Female: (Calculate from total)
Total Salary: 707K
Count Department: 27
Employees with Commission: 35 (32%)
Employees without Commission: 73 (68%)
Data Visualizations (Charts & Graphs):
Pie/Doughnut Chart: For "Gender Distribution" (Male vs. Female).
Bar Chart: For "Sum of Salary by Egypt_City" (showing values for Cairo, Aswan, Alex, Tanta).
Donut Chart: For "Count of Employee by Egypt_City".
Another Chart: To represent the "Count of Manager_ID by Job_Title" (as shown in the second image).
Horizontal Bar Chart: Visualizing the "Count of Employee_ID by Department_Name" (Shipping, Sales, Executive, Finance, Purchasing) with percentages.
Data Tables:
Implement interactive data tables for:
"Total Employees" list with Name, Count, and Commission_PCT.
"Total Female Sales" list with Name, Count, and Commission_PCT.
Tables should ideally support features like sorting or searching.
Interactivity (Preferred):
While the reference is static, the ideal dashboard will have interactive elements such as:
Tooltips showing precise values when hovering over chart elements.
Filters to view data by specific cities, departments, or other criteria.
The ability to click on a chart segment (e.g., a city) to update other visuals on the page accordingly.
Technology Stack (Preferences):
Front-End: React.js (preferred), Vue.js, or modern JavaScript.
Data Visualization Library: D3.js, Chart.js, ApexCharts, or Recharts (for React).
Styling: CSS-in-JS (Styled-Components), SASS, or Tailwind CSS for a modern look.
Deliverables:
Fully functional, self-contained source code.
A link to a live demo of the hosted dashboard.
Clean, commented, and maintainable code.
100% responsiveness for desktop and tablet views.
Ideal Candidate:
Proven experience in building single-page applications (SPA) and data dashboards.
Strong portfolio showcasing data visualization projects.
Proficiency with JavaScript and its modern frameworks (React/Vue).
Experience with data visualization libraries (D3.js, Chart.js, etc.).
An eye for modern UI/UX design and the ability to replicate a provided layout accurately.
Ability to work with structured data and implement it into visual components.
How to Apply:
Please submit your proposal with:
Examples of similar dashboards you have built.
Your proposed tech stack for this project.
An estimated timeline and cost.
Any initial questions you have about the project.
Thank you for your interest! I look forward to your proposals.