Heart Disease Dashboard
تفاصيل العمل
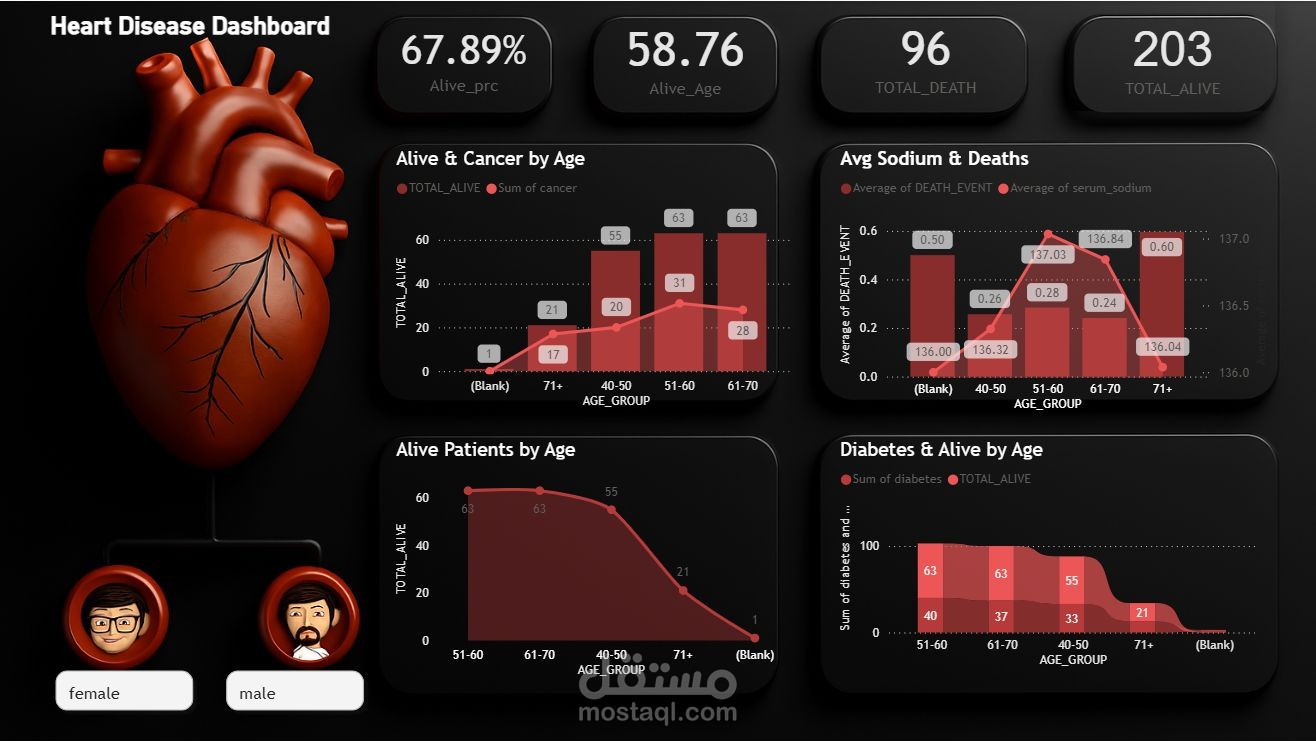
My First Power BI Project – Heart Disease Dashboard
Excited to share my very first Power BI Dashboard, completed after finishing the amazing course by Eng. Al-Munther Safwan!
Project Highlights:
Analyzing heart disease data by age groups
Monitoring serum sodium levels and death events
Exploring the relationship between diabetes and age
Interactive design using 3D Visuals
What I Learned:
Building professional Dashboards
Utilizing DAX Functions for data analysis
Designing attractive Visualizations
Analyzing healthcare data effectively
Special thanks to Eng. Al-Munther Safwan for the clear and insightful explanations!
Course Link
hashtag#PowerBI hashtag#DataAnalysis hashtag#HealthcareAnalytics hashtag#DataVisualization hashtag#BusinessIntelligence hashtag#FirstProject