dashboard using Power BI to analyze the impact of weather conditions on flight operation
تفاصيل العمل
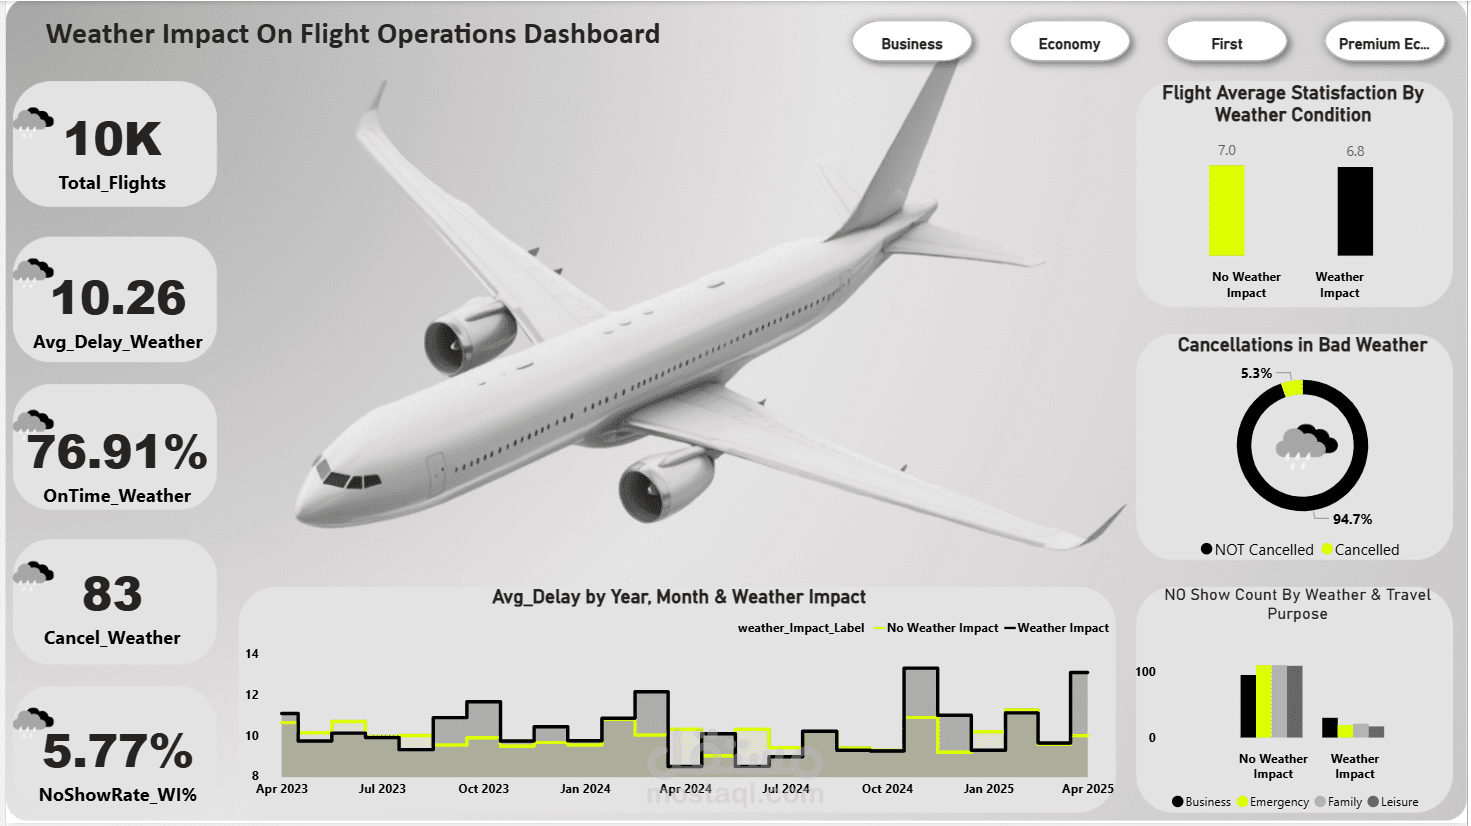
أنهيت مؤخرًا تصميم داشبورد تفاعلي باستخدام Power BI لتحليل تأثير حالة الطقس على عمليات الطيران، ودي كانت تجربة غنية جدًا في تحليل البيانات وعرضها بشكل بصري بسيط واحترافي.
الداشبورد بيعرض أهم المؤشرات:
- عدد الرحلات الكلي
- متوسط التأخير بسبب الطقس
- نسبة الالتزام بالمواعيد رغم العوامل الجوية
- معدل الإلغاء وعدم الحضور بسبب الطقس
- مستوى رضا العملاء في الظروف المختلفة
الهدف من الداشبورد هو تسهيل اتخاذ القرار وتحليل المخاطر التشغيلية المرتبطة بالطقس، وتقديم رؤية واضحة لإدارة شركات الطيران.
يسعدني معرفة آرائكم ومقترحاتكم!
hashtag#PowerBI hashtag#DataAnalytics hashtag#Dashboard hashtag#Aviation hashtag#DataVisualization hashtag#تحليل_بيانات hashtag#الطيران
I recently developed an interactive dashboard using Power BI to analyze the impact of weather conditions on flight operations—a truly insightful experience in data analysis and visualization!
The dashboard showcases key metrics such as:
- Total number of flights
- Average delay due to weather
- On-time performance under different weather conditions
- Cancellation and no-show rates caused by weather
- Customer satisfaction in various scenarios
The main goal is to support decision-makers in assessing operational risks and understanding how weather affects airline performance, all through clear and actionable visuals.
I’d love to hear your feedback and thoughts!
hashtag#PowerBI hashtag#DataAnalytics hashtag#Dashboard hashtag#Aviation hashtag#DataVisualization