Sales Data Analytics Dashboard Built with Power BI
تفاصيل العمل

Sales Data Analytics & Visualization Project
This project involved transforming a raw CSV sales dataset into an interactive and insightful business intelligence dashboard using Microsoft Power BI. The core objective was to model the data effectively and create key performance indicators (KPIs) to analyze sales performance, financial metrics, and operational data.
Key Tasks Performed:
· Data Connection & ETL: Connected Power BI to the sales.csv file and performed basic data transformation.
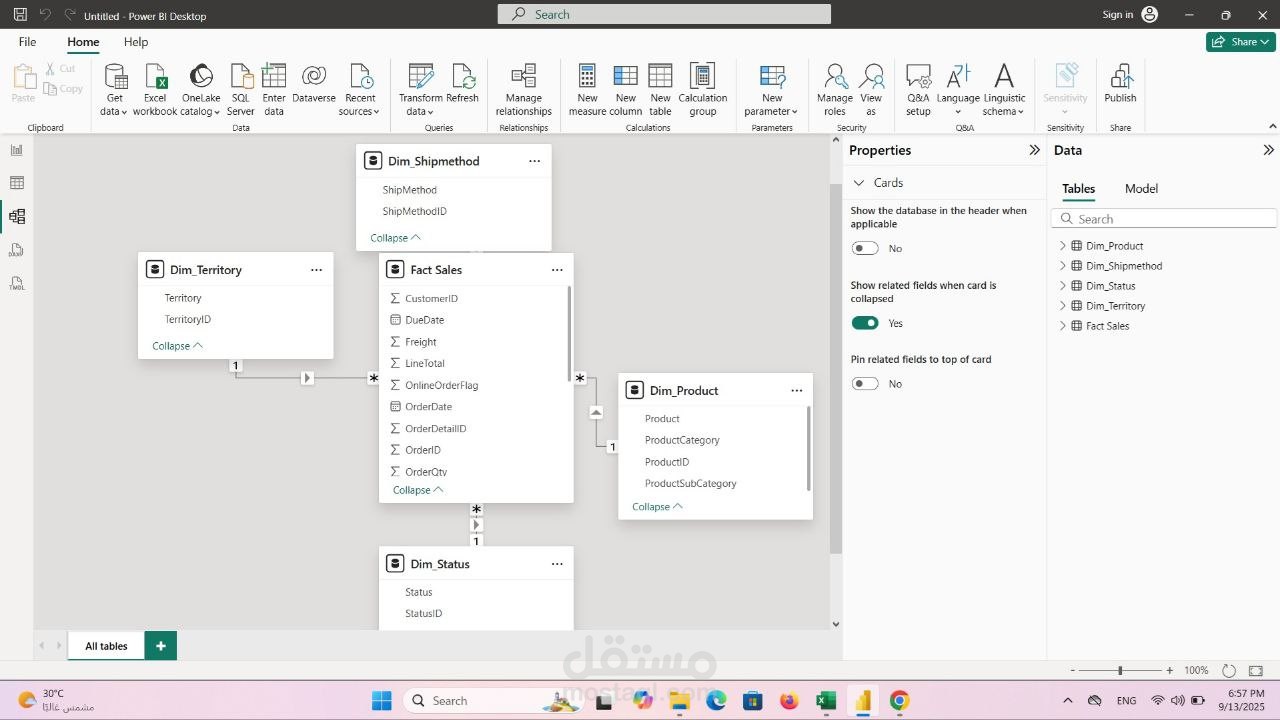
· Data Modeling: Designed a structured data model by establishing relationships (connections) between fact and dimension tables (e.g., connecting Fact_Sales to Dim_Product, Dim_Customer).
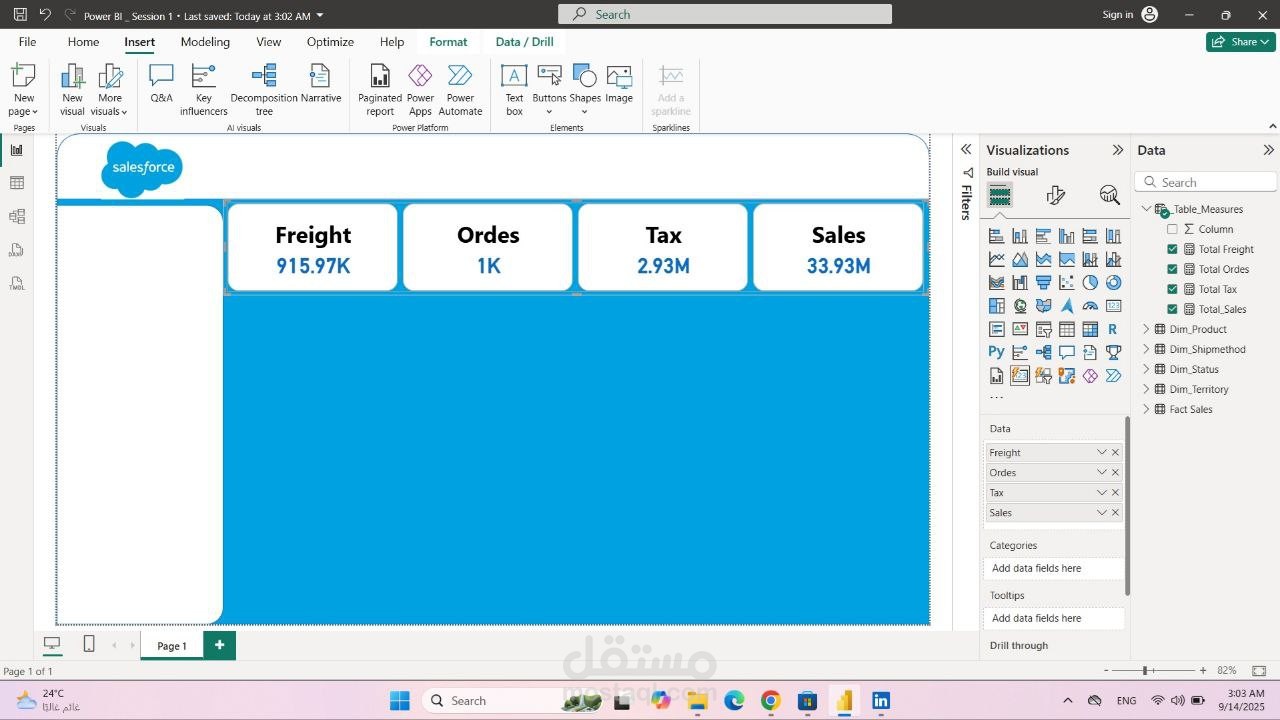
· Measure Creation: Developed calculated measures and KPIs using DAX (Data Analysis Expressions) to analyze critical metrics such as:
· Total Sales: $33.93M
· Total Freight Cost: $915.97K
· Total Tax: $2.93M
· Total Orders: 1K
· Data Visualization: Built an interactive visual report with charts, graphs, and tables to allow for dynamic exploration of the data.
Technical Stack:
· BI Tool: Microsoft Power BI
· Data Processing: Power Query (ETL)
· Data Modeling: Relationship Building, Star Schema
· Calculation Language: DAX (Data Analysis Expressions)
· Core Skills: Data Visualization, Business Intelligence, Data Modeling, KPI Development
Outcome: The project resulted in a centralized,interactive dashboard that provides a 360-degree view of sales operations. Stakeholders can now easily track performance, analyze trends, and drill down into specific areas of interest, enabling data-driven decision-making for the business.