Health Data Analysis: Visualizing Vital Signs with Python & Seaborn
تفاصيل العمل

Health Data Analysis & Visualization Project
This project demonstrates a complete Exploratory Data Analysis (EDA) workflow for health monitoring data. Executed in a Google Colab environment using Python, the task focused on loading, processing, and visually exploring key vital signs to uncover underlying distributions and patterns.
Key Tasks Performed:
· Loaded and processed the healthmonitoring.csv dataset using Pandas.
· Performed initial data cleaning and preparation to ensure analysis readiness.
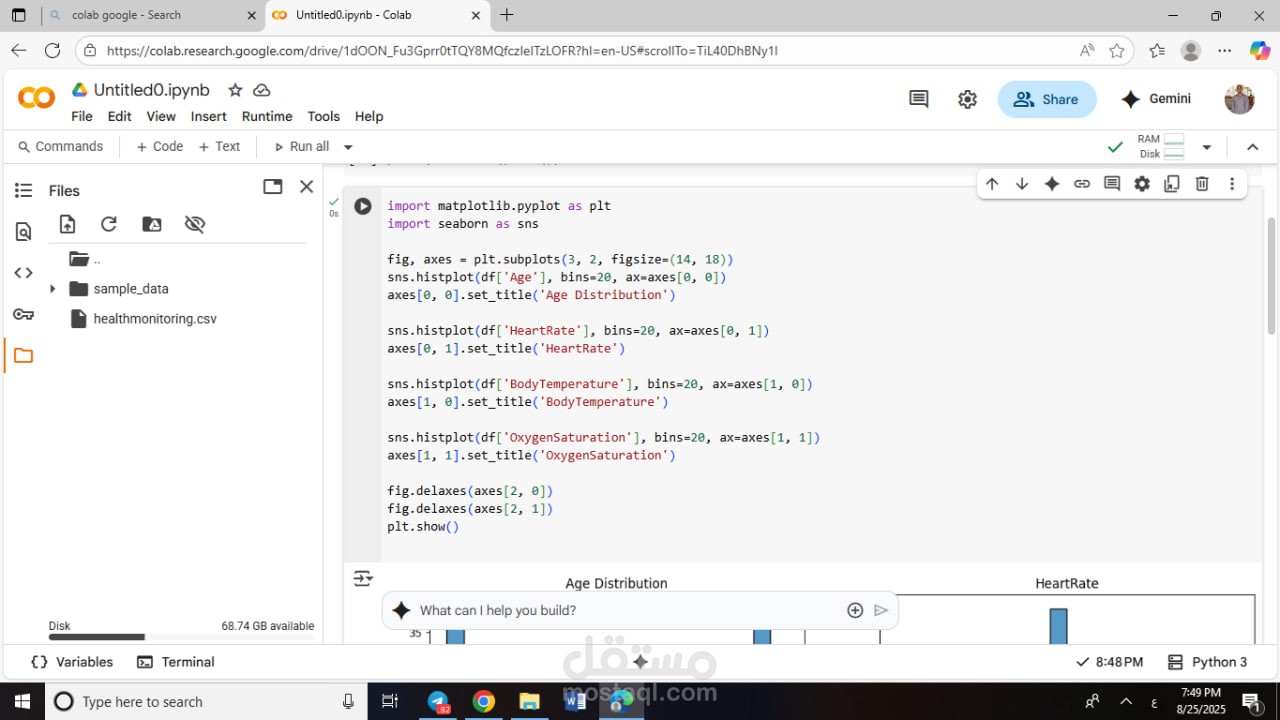
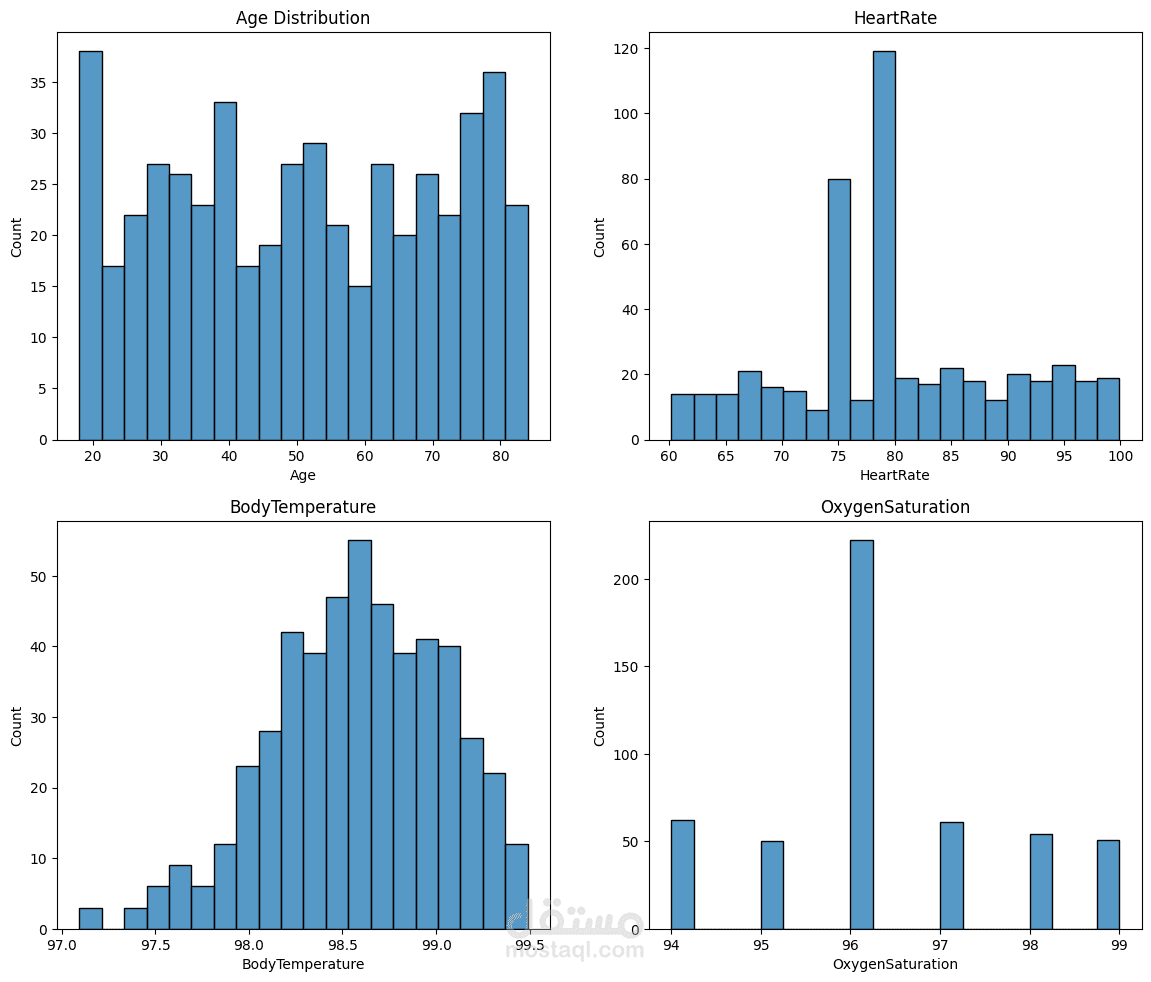
· Generated a comprehensive set of histograms for critical health metrics: Age, Heart Rate, Body Temperature, and Oxygen Saturation.
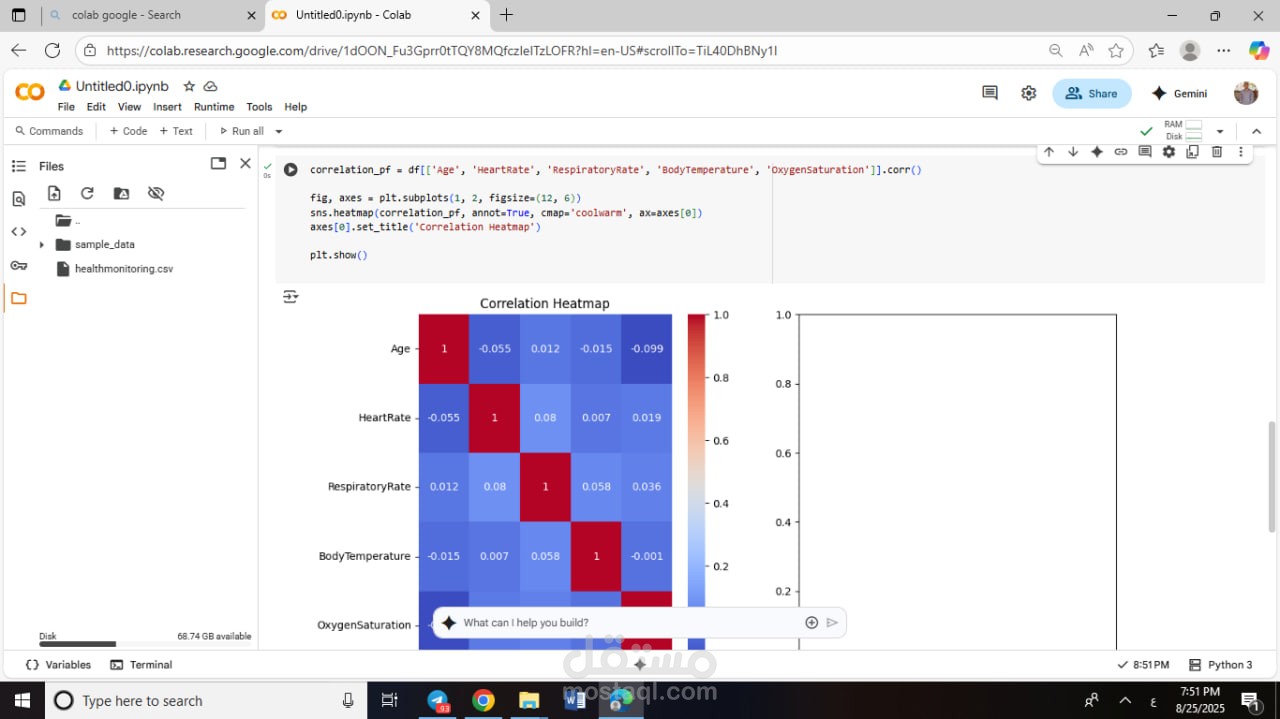
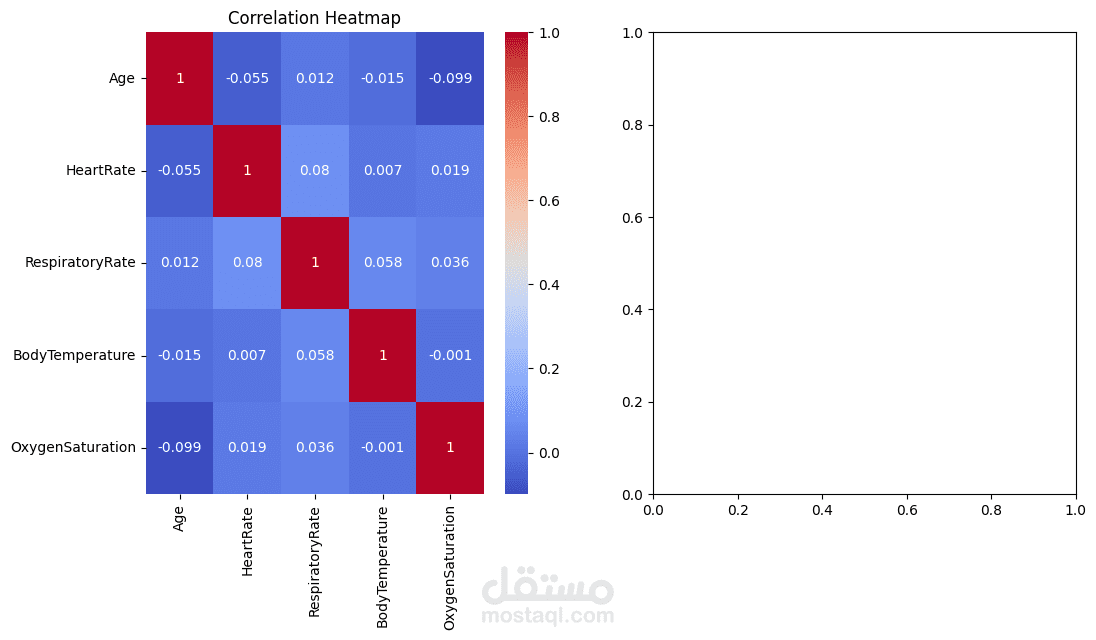
· Utilized Matplotlib and Seaborn libraries to create professional, clear, and informative visualizations.
Technical Stack:
· Programming Language: Python
· Environment: Google Colab
· Libraries: Pandas, NumPy, Matplotlib, Seaborn
· Core Skills: Data Cleaning, Data Analysis, Data Visualization, Exploratory Data Analysis (EDA)
Outcome: The project successfully transformed raw health data into an insightful visual dashboard. The visualizations provide immediate, at-a-glance understanding of the distribution for each vital sign, which is a crucial first step for any further statistical analysis or machine learning modeling in the healthcare domain.