Madrid Real Estate Data Analysis (Python, SQL, Power BI | 21,000 Records)
تفاصيل العمل
Madrid Real Estate Data Analysis This project provides a complete data analysis pipeline for real estate listings in Madrid. It covers data cleaning, feature engineering, SQL-based aggregation, and an interactive Power BI dashboard for stakeholder-ready insights.
Madrid_Real_Estate_Analysis ├── House_Madrid.html ← Final Python notebook (cleaning + EDA) ├── Madrid_house_data.pdf ← Power BI dashboard export ├── real_estate_views.sql ← SQL views for KPIs and data modeling ├── README.md ← Project summary and instructions Tools Used Python: pandas, seaborn, plotly for cleaning and EDA
SQL (SQL): building summary views and dimensional modeling
Power BI: interactive visualizations, KPI cards, and filters
Key Features & KPIs Cleaned and validated dataset of ~21,000 properties
Feature engineering:
price_category (Low, Medium, High)
price_per_room, area_per_room
SQL views for:
property_summary_by_district – metrics like price/m², % with lift, parking
fact_properties, dim_district, dim_features – for Power BI model
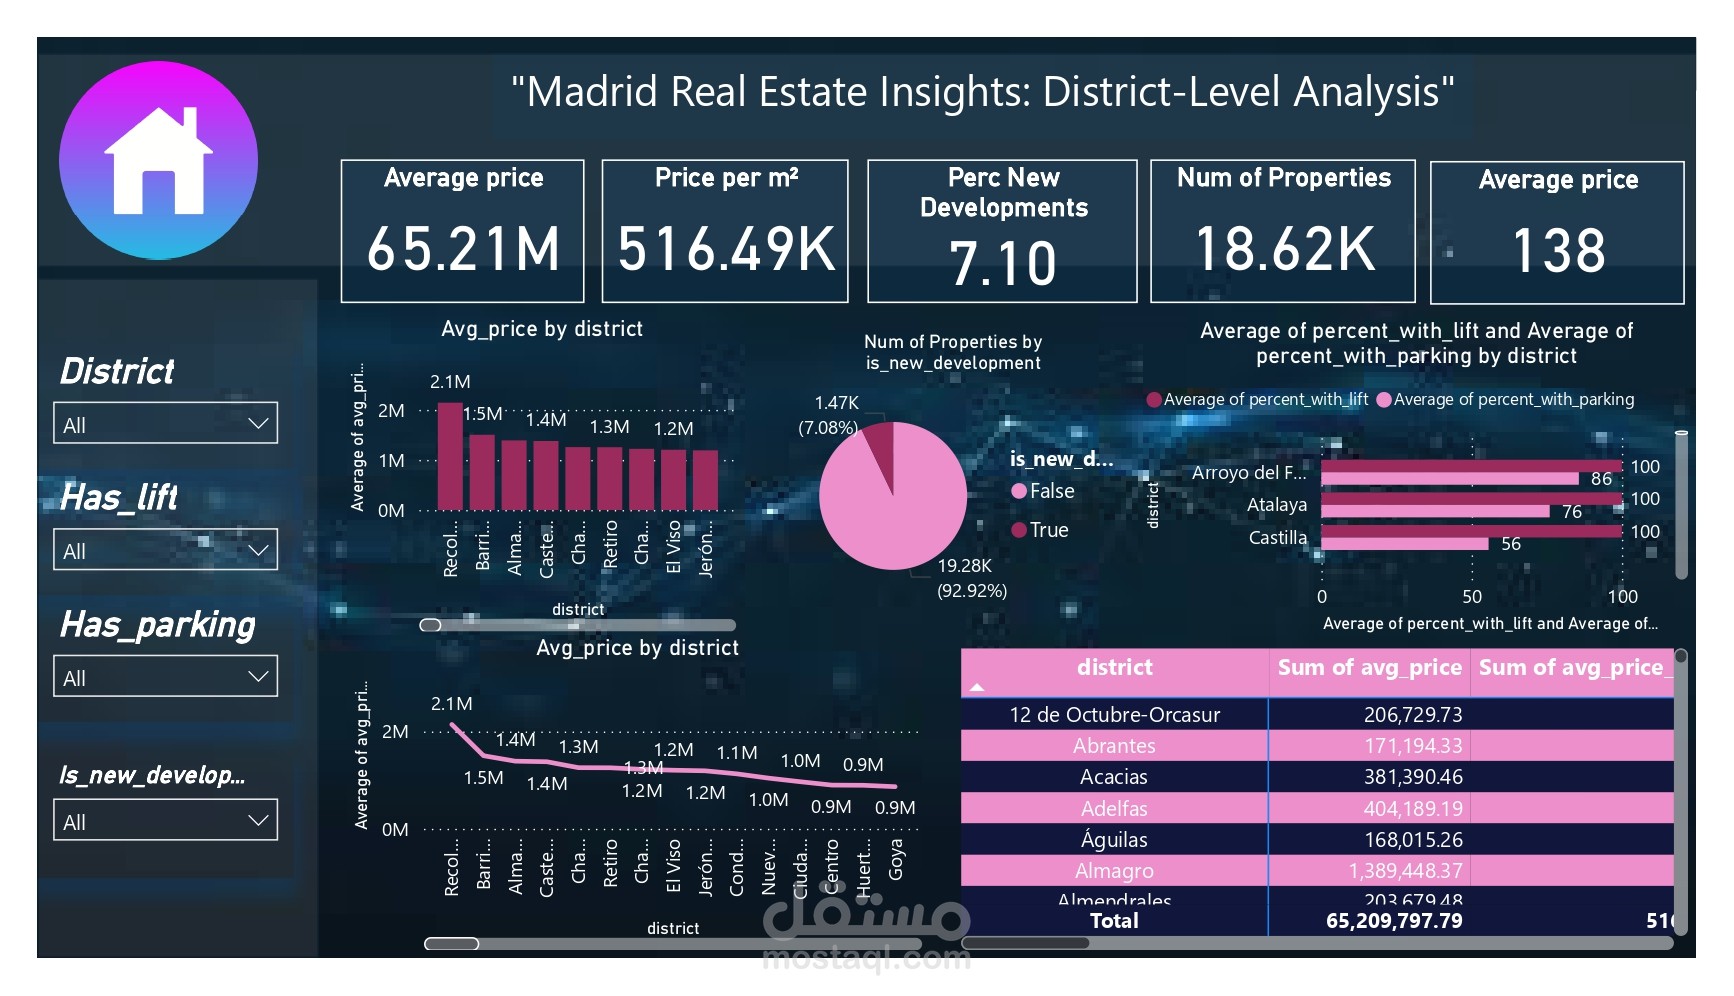
Power BI dashboard includes:
Slicers: district, lift, parking, new development
KPI Cards: average price, price/m², % new developments
Bar / Line / Pie Charts
Matrix table with conditional formatting
Sample Insights Highest prices/m² in El Viso, Almagro, and Ibiza districts
20% of listings are new developments
Over 45% of properties offer private parking
Elevators available in ~60% of properties
How to Use Clone the repo
Open the notebook (House_Madrid.html) to explore the EDA
Review SQL logic in real_estate_views.sql
Open Power BI dashboard or .pdf preview to explore visuals