Bicycle Sales Analysis (Power BI Project)
تفاصيل العمل
Bicycle Sales & Accessories Analysis (Power BI Project)
Introduction
This project analyzes sales data from a Bicycle & Accessories company.
The challenge was not only to build dashboards but also to identify business problems, understand their causes, and propose actionable recommendations.
The analysis was done entirely using Power BI.
Dataset
Rows: ~23,000
Period: June 2011 → May 2014
Products: ~250
Subcategories: 33
Categories: 3
Products under the same subcategory usually differ only in size or color, so analysis focused mainly on Subcategory level.
️ Methodology
Data Cleaning & Preparation
Fixed missing values, incorrect data types, duplicates.
Created calculated columns: Tax %, Freight %, Cancelled/Rejected Flags.
Data Modeling
Built relationships between Orders, Products, Customers, and Sales Reps.
Defined hierarchies: Territory → Salesperson → Product.
DAX Measures
Total Sales
Total Orders
Cancelled Orders %
Customer Retention Rate (CRR)
New Products per Year
Top Product per Sales Rep
Visualization in Power BI
Sales by Territory & Salesperson
Product Performance
Year-over-Year Customer Retention
Cancellation & Rejection Analysis
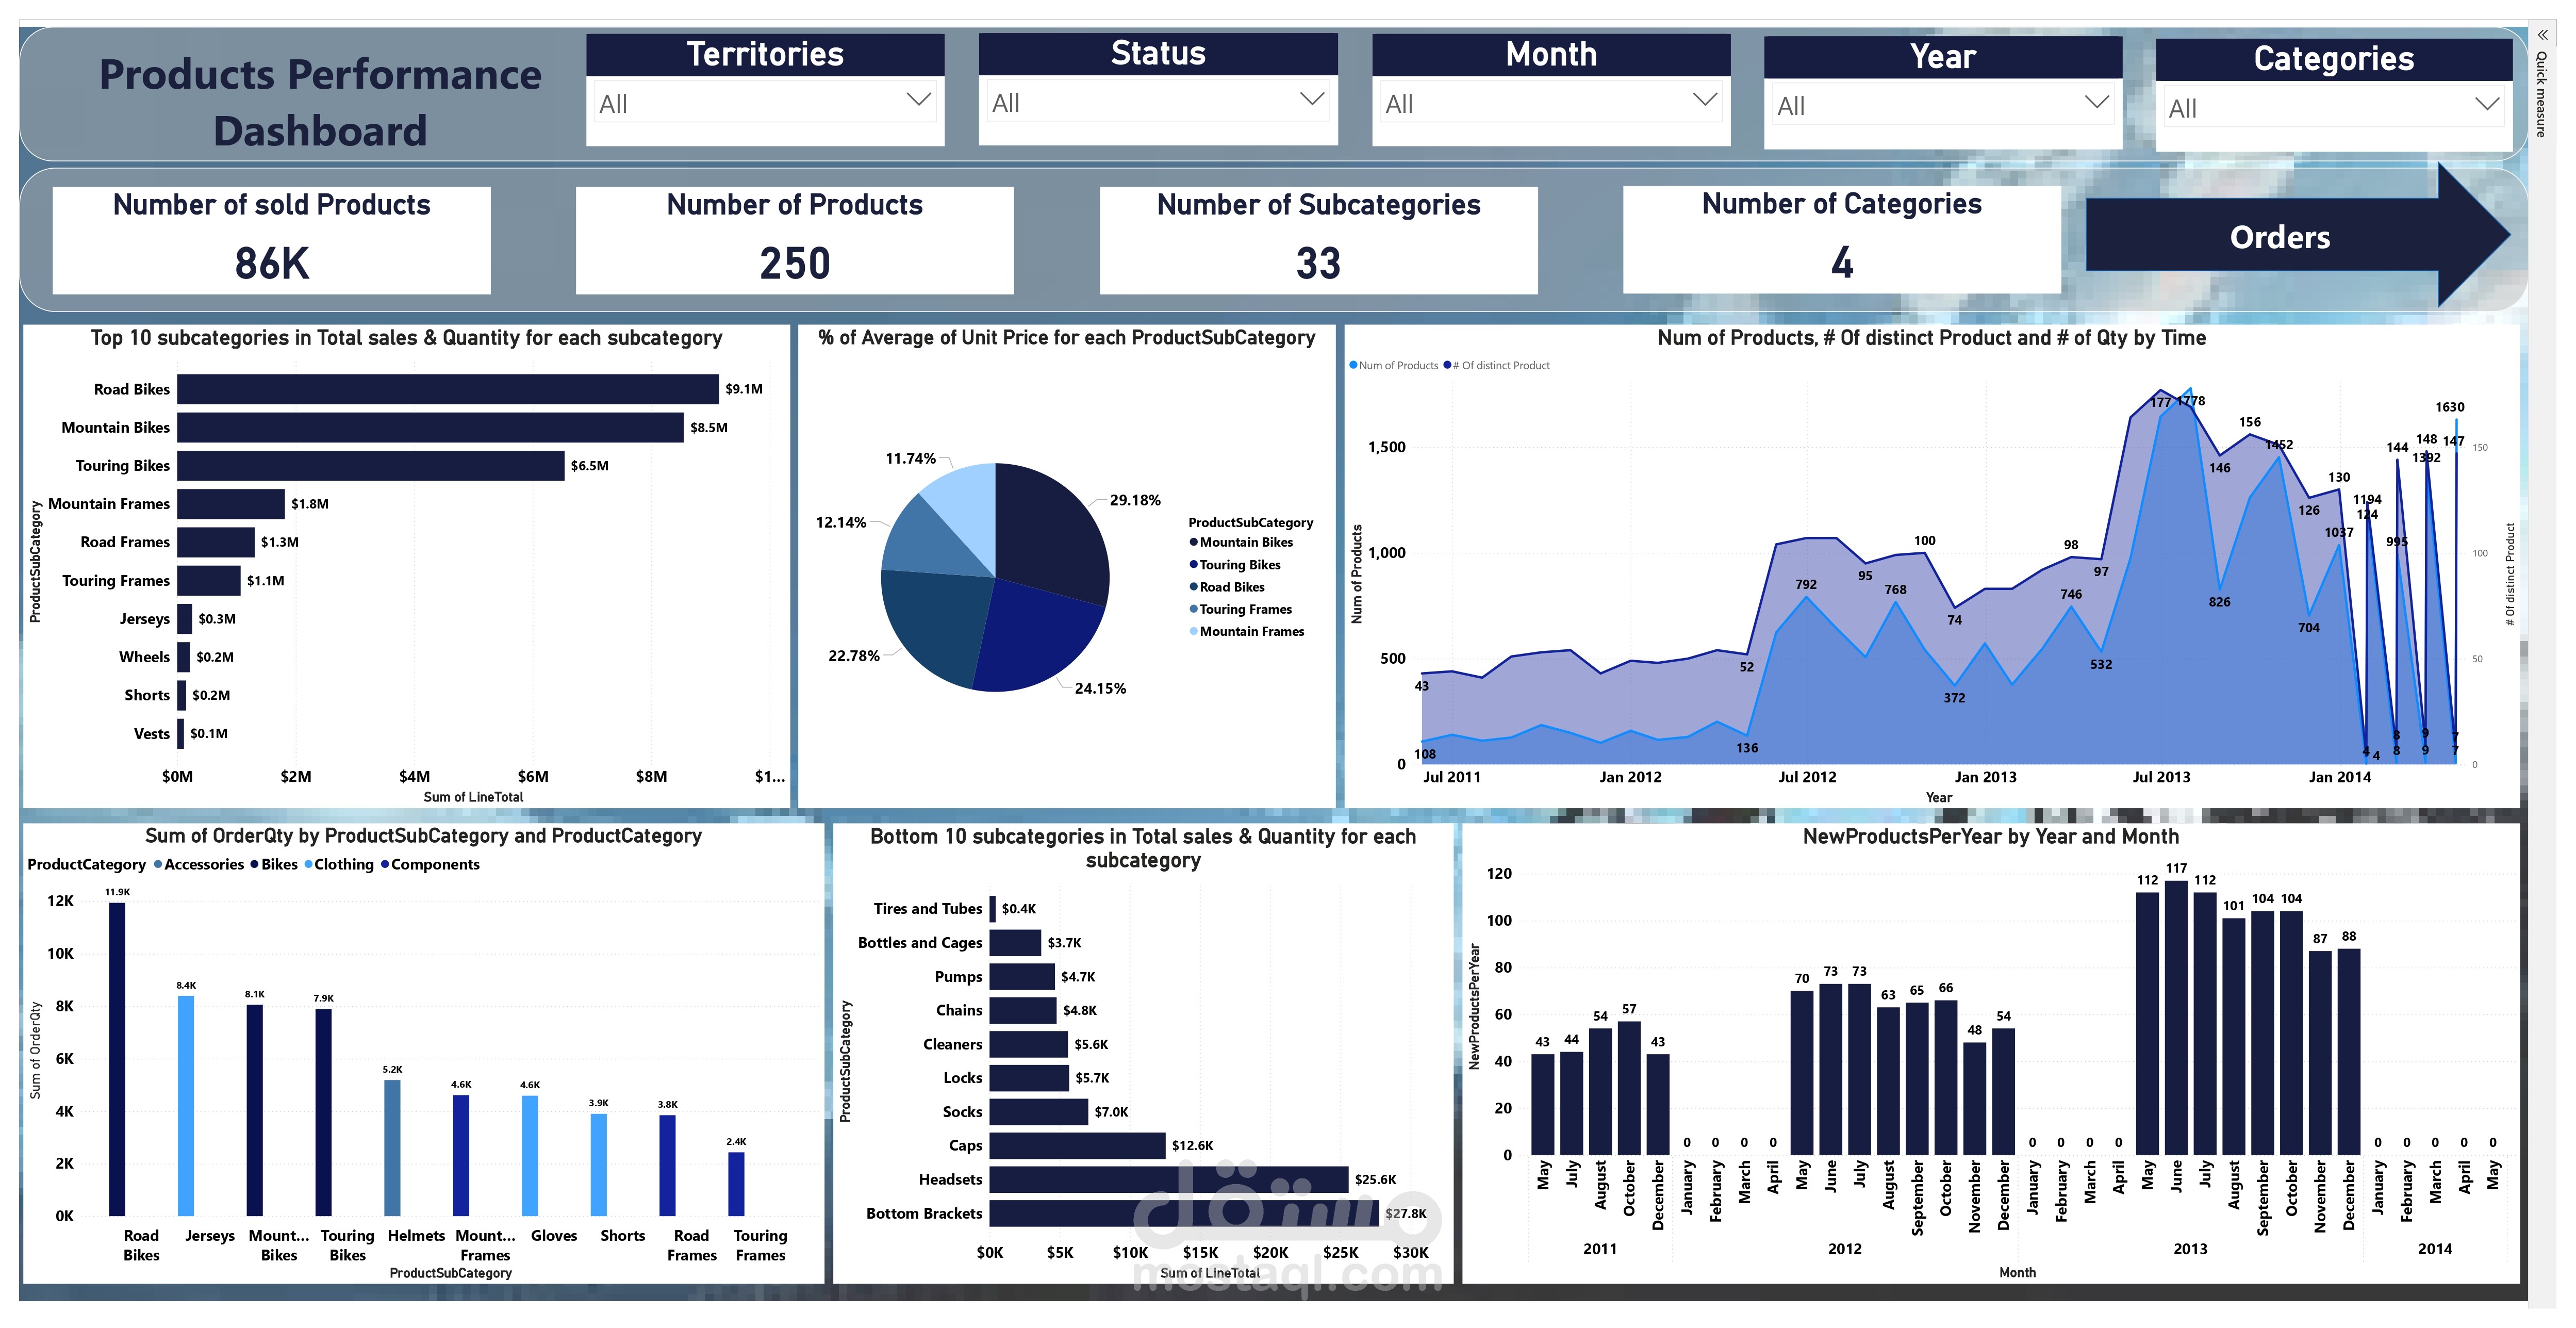
Key Findings
Products
Top Selling Category: Road Bikes → $9.1M
Lowest Selling Category: Tires & Tubes → $0.4K
Most Expensive Category: Mountain Bikes
Orders & Territories
Total Orders: 1,465
Top Country: Canada (~$9.4M revenue)
Sales in 2013 grew significantly due to more products and sales reps.
2014 Issue: Missing sales in Feb & Apr due to reporting delay (orders reported on the 1st of next month).
Order Fulfillment: Minimum ~12 days (7 days shipping + 5 days delivery), can be longer depending on reporting and availability.
Customers
Total customers: 294 (mainly individuals & small shops).
Customer base doubled in 2013, but repeat orders were very low (only 11 customers placed 12 repeat orders).
Customer Retention Rate (CRR):
2012 → 92%
2013 → 79%
2014 → 69% (declining trend).
Salespersons
Best performer: Rep #289 (Canada) → $5.48M sales.
Territory distribution not proportional to sales (Canada outperformed with fewer reps).
6/10 sales reps performed best in Road Bikes, the rest in Mountain Bikes.
Order Status
Cancelled Orders: 10.9%
Rejected Orders: 8.5%
Both rates are high and need action.
Recommendations
Order Processing Efficiency
Implement real-time reporting system.
Set monthly cutoff dates to avoid shifting orders into next month.
Customer Retention Strategy
Launch loyalty programs.
Offer bulk purchase discounts.
Maintain customer follow-ups & feedback.
Customer Segmentation (B2B Focus)
Shift focus from individuals/small shops to larger retailers and small businesses.
Create B2B packages and long-term contracts.
Product Portfolio Optimization
Continue adding new products annually.
Reconsider low-performing products (e.g., Tires & Tubes).
Focus marketing on top sellers (Road Bikes).
Salesforce Management
Share best practices from top performers.
Provide territory-based training & incentives.
Balance reps distribution across regions.
Order Cancellations & Rejections
Investigate root causes (inventory, delivery, pricing).
Improve stock forecasting.
Strengthen communication with customers.