sales dashbord
تفاصيل العمل
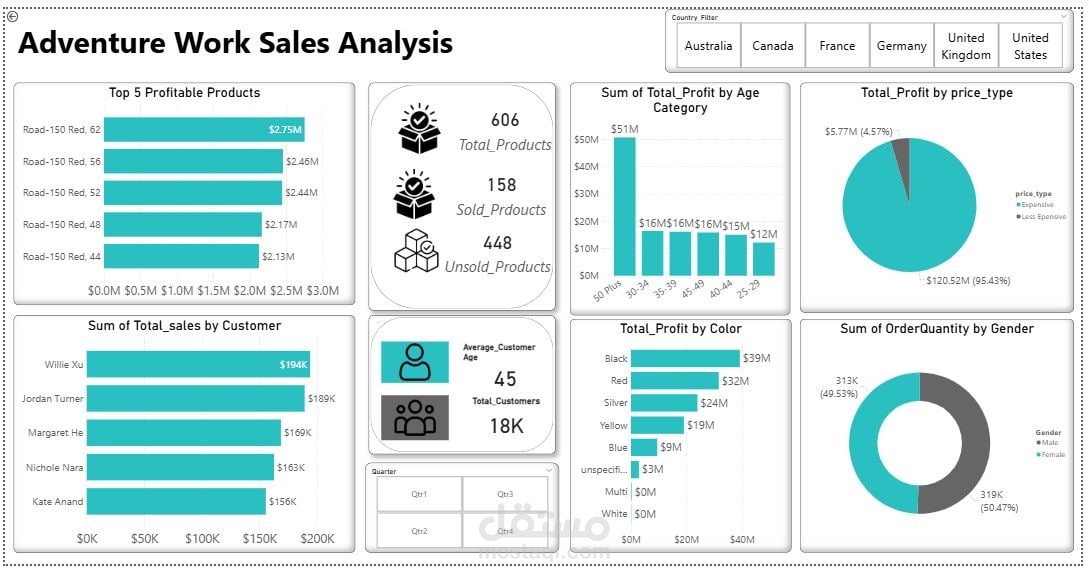
KPIs at a glance: Revenue, Profit, Expenses, and Profit Margin.
Trends over time: Sales and profit analysis by year, quarter, and month.
Transaction insights: Breakdown by type (Cash, Credit, Debit, etc.).
Performance by category: Day-wise and weekday vs weekend profit distribution.
Interactive filters: Allowing users to explore data across years, months, and transaction types.
Added Value:
Enables faster reporting and monitoring of business performance.
Highlights profit drivers and areas for cost optimization.
Helps management make data-driven strategic decisions