hospital dashboard
تفاصيل العمل
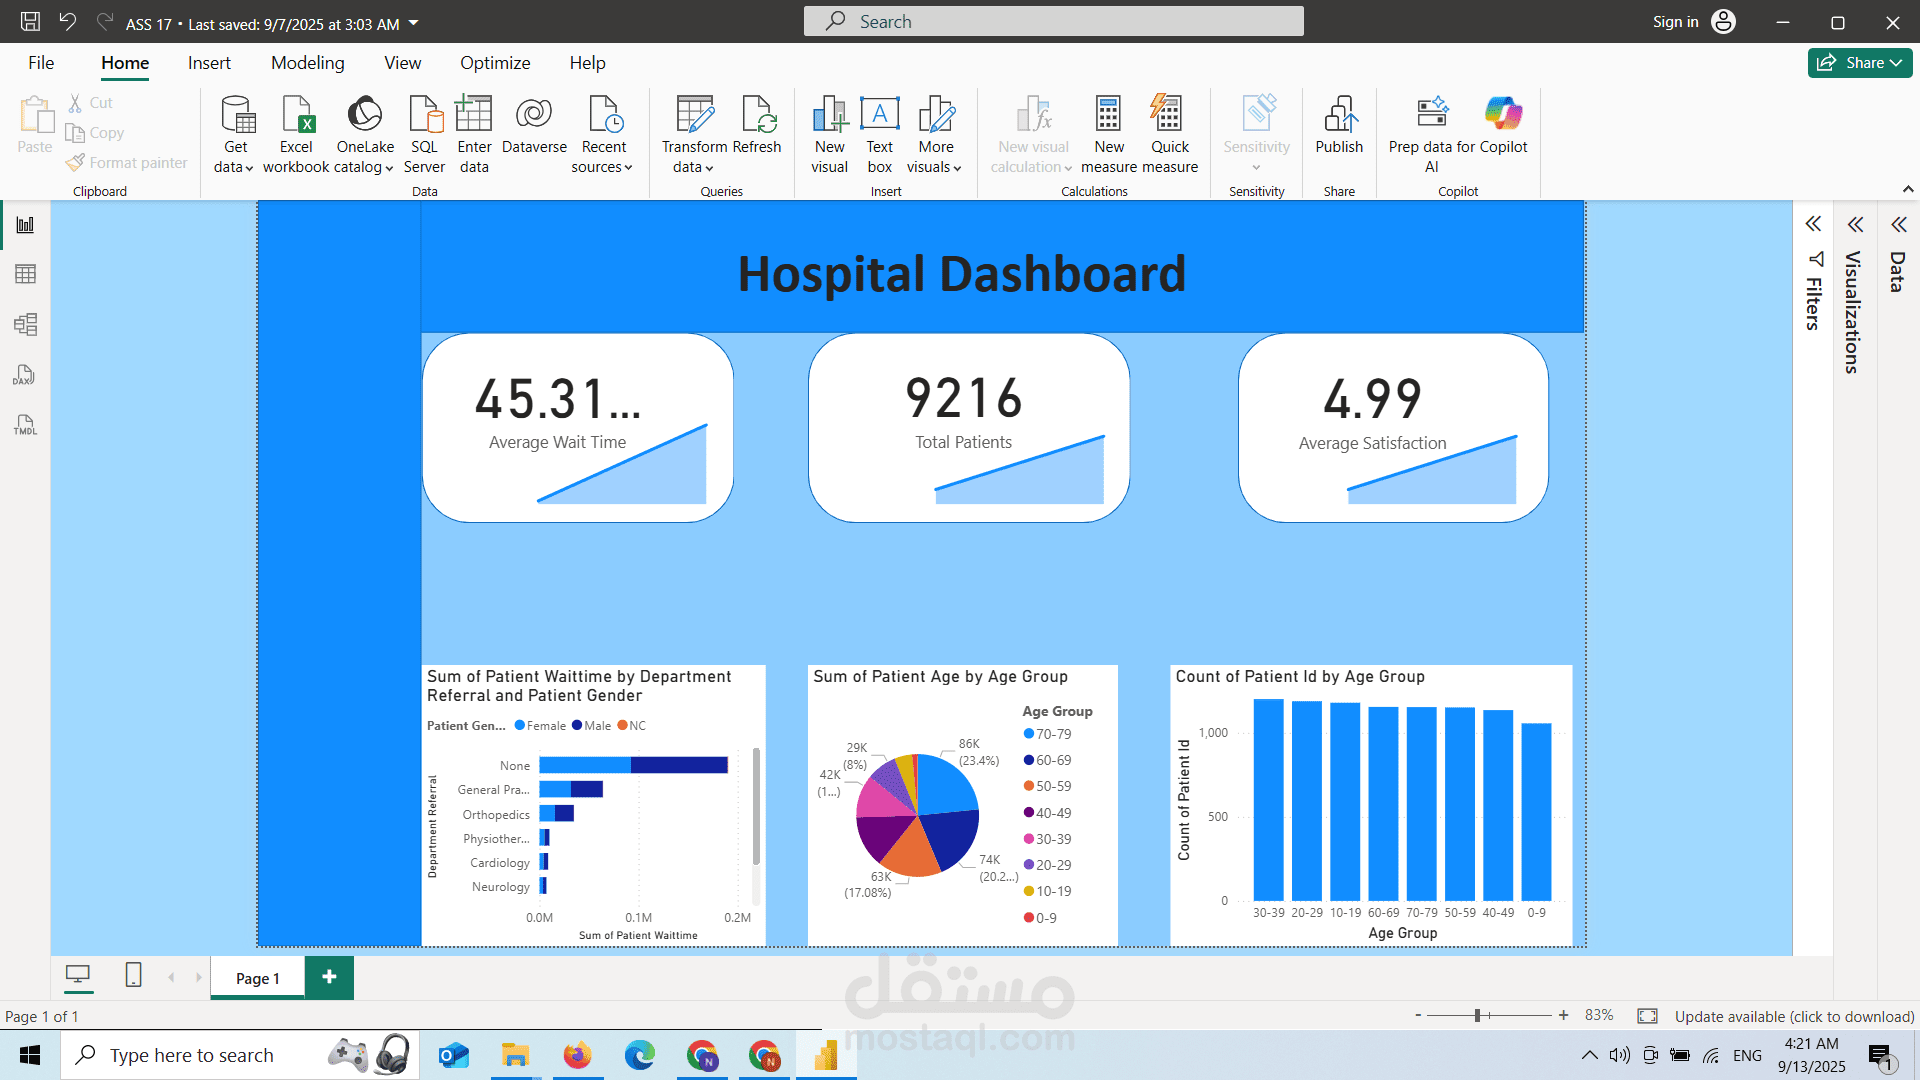
Average Wait Time: 45.31 minutes.
Total Patients: 9,216.
Average Satisfaction: 4.99 (showing excellent patient experience).
Patient Wait Time by Department & Gender: Identifying which departments have the longest waiting times and analyzing gender distribution.
Patient Age Distribution: A pie chart highlighting the age group breakdown of patients (largest group: 60–69 years).
Patient Count by Age Group: A bar chart comparing patient volume across all age categories.