ٍSales Dashboard
تفاصيل العمل
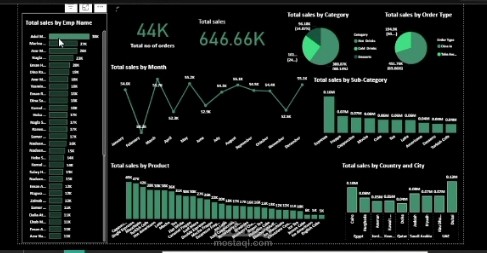
Project 1: Sales Analysis Dashboard (Summary)
In this project, I developed a comprehensive Sales Analysis Dashboard in Power BI to provide business insights and track key performance metrics. The process began with importing and connecting multiple datasets (Orders, Branches, Employees, Products) and ensuring proper relationships.
I then created necessary calculations, including Sales, Total Orders, and Total Sales, using DAX. To visualize the data effectively, I designed multiple charts that display trends and breakdowns by country, city, category, subcategory, products, employees, and order type.
Additionally, KPI cards were added to highlight Total Sales and Total Orders, and consistent formatting was applied to ensure a professional, user-friendly design.
Outcome:
A dynamic dashboard that helps businesses monitor sales performance, identify top-performing categories, and analyze trends across different regions and dimensions.