Manufacturing Defects Analysis
تفاصيل العمل

Overview:
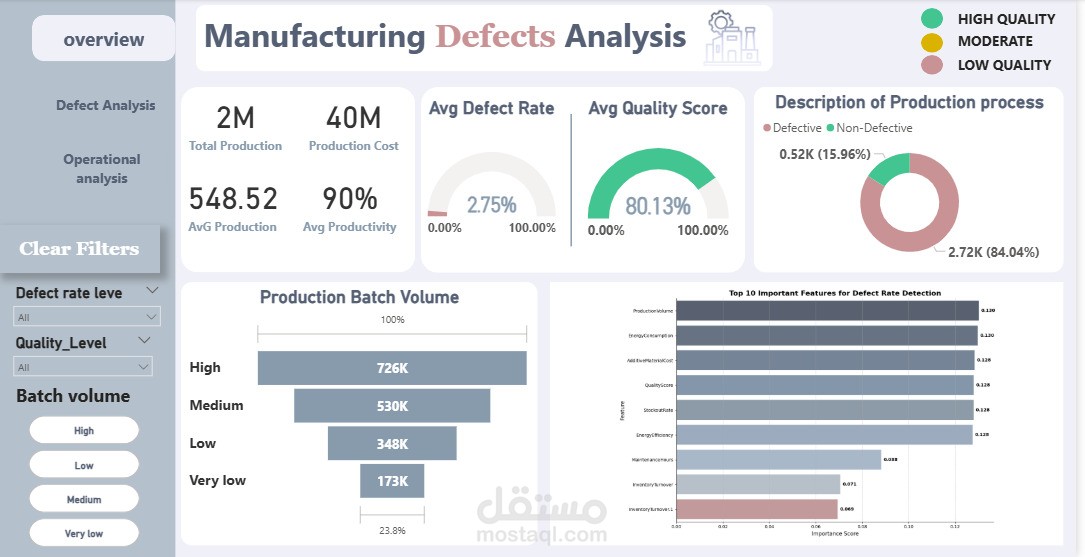
Designed an interactive dashboard to analyze manufacturing defects and quality performance. The dashboard provides insights into defect rates, cost impact, and production efficiency, helping managers improve decision-making and reduce waste.
Problem:
The client needed a clear way to monitor product defects, understand their financial impact, and identify the main causes affecting quality.
Solution:
Cleaned and organized raw production and defect data
Built a structured data model to support dynamic reporting
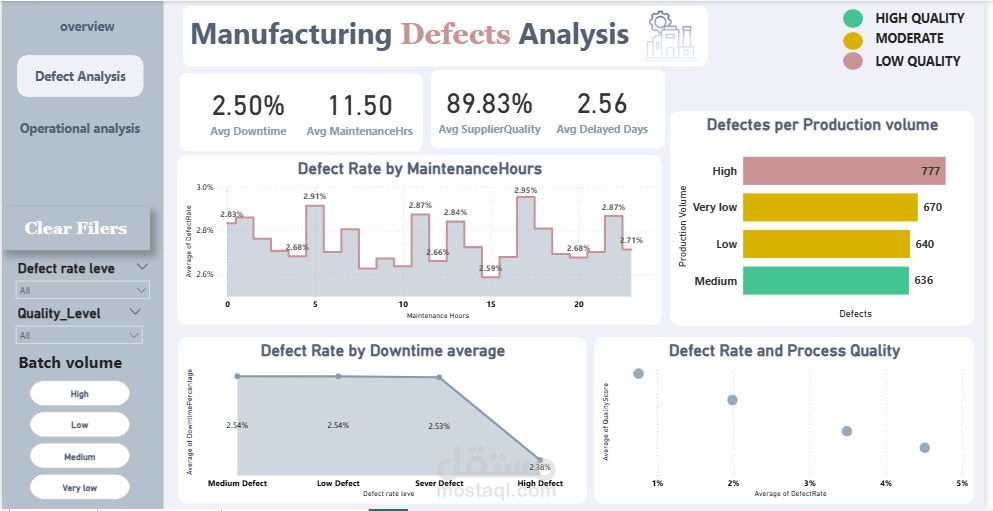
Designed a Power BI dashboard with:
Defect rate by batch and category
Cost impact of defects on total production
Root causes analysis for quality issues
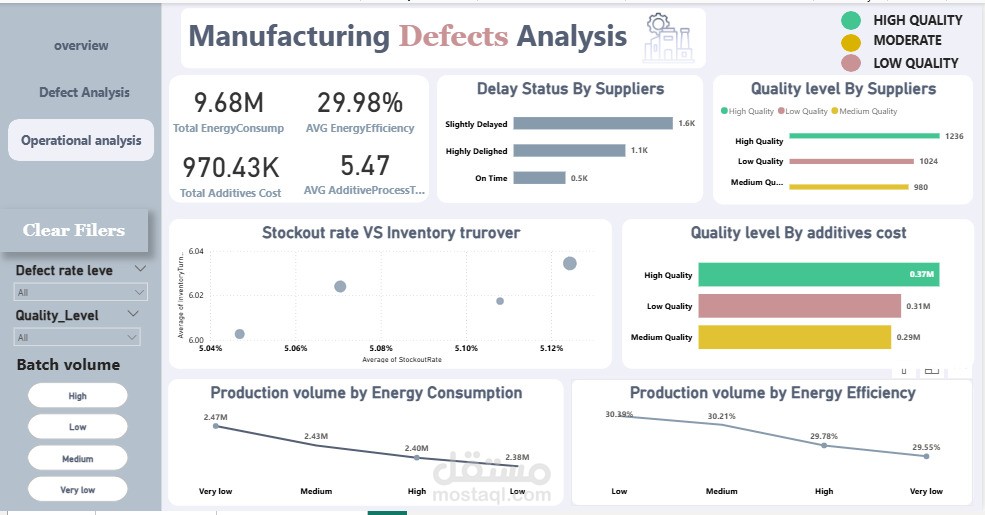
Supplier performance and production efficiency indicators
Tools Used:
Power BI, Excel, Data Modeling, DAX
Results:
Identified top 3 factors contributing to 70% of defects
Helped reduce reporting time from days to minutes
Provided management with actionable insights to reduce defect-related costs and improve quality control